Azure DevOps OData Reporting
Azure DevOps OData Reporting provides an easier alternative to Analytics Views while maintaining a similar reporting experience in Power BI. One of the most common questions when moving away from Azure DevOps Analytics Views is how to recreate the same reporting experience without the complexity of creating multiple tables and complex relationships. The good news is that the ODATA entities (tables) provide a method to include the fields from related tables in a single query results. This allows for a denormalized dataset very similar to what Analytics Views (AV) provide.
In this blog post, I will show how to create an ODATA query that is scoped to a single Team Project and returns work item data together with Iteration, Area Path, Project, and User information in a single result set. For many reporting scenarios, this eliminates the need for separate dimension tables and simplifies both the Power Query and Power BI data model. Once you understand the pattern, you can easily extend the approach to support multiple Team Projects, additional custom fields, or more advanced filtering requirements.
Analytics Views support many reporting use cases effectively. However, when you have a large number of work items or complex reporting needs, the ODATA connector type is a superior choice. In this post <Add Link> , I will discuss why you may want to opt for ODATA instead of Analytics Views. Some examples are having more control over fields and filters as well as manipulating the structure of the dataset itself. If your reporting needs are meant to scale or be maintained long-term, I suggest using ODATA.
THE ODATA QUERY:
This query is a normalized, or flat file, representation of the Work item data in ADO. It contains the iterations, area paths, team project, and user information within the table. This work item table is single-dimensional and returns all related data in each row. This eliminates the need for separate tables, such as iterations and area paths as this information is in each row of data. This method is sufficient for basic ADO reporting, like tracking the status of bugs per iteration or work item counts. Advanced reporting will require dimensional tables to help the Power BI report scale and provide the model to create advanced DAX measures. This approach is the simplest way to start reporting with ADO data and is easy to maintain.
Follow the steps in this blog post to learn how to run the query in VS Code to test. Make sure the query works in VS Code before adding to your Power BI report. It will save you so much time when debugging issues. Replace <Your ADO Org> and <Your Team Project> with values from your ADO organization. Follow the steps in this blog post on how to determine this information.
NOTE: Make sure to remove the clause $&Top=10 when adding to Power BI. This is for testing purposes only.
This query contains the common work item fields that appear is all three of the base templates. Add and remove fields as needed for your reporting needs.
https://analytics.dev.azure.com/<Your ADO-Org>/<Your Team Project>/_odata/v4.0-preview/Workitems?
$select=WorkItemId,Title, WorkItemType, State, AnalyticsUpdatedDate,  InProgressDate, CompletedDate, LeadTimeDays, CycleTimeDays, ProjectSK, WorkItemRevisionSK, AreaSK, IterationSK, Revision, Watermark, ChangedDate,CreatedDate Reason, FoundIn, IntegrationBuild, ActivatedDate, Activity, BusinessValue, ClosedDate, Issue, Priority, Rating, ResolvedDate, ResolvedReason, Risk, Severity, StackRank, TimeCriticality, ValueArea, CompletedWork, DueDate, Effort, FinishDate, OriginalEstimate, RemainingWork, StartDate, TargetDate, ParentWorkItemId, TagNames, StateCategory, StateChangeDate, CommentCount
&$expand=AssignedTo($select=UserName;$filter=UserName ne null),CreatedBy($select=UserName;$filter=UserName ne null),ClosedBy($select=UserName;$filter=UserName ne null),ResolvedBy($select=UserName;$filter=UserName ne null)
&$expand=Project($select=ProjectName,ProjectID,ProjectSK),Iteration($select=IterationPath,IterationName,IterationSK,StartDate,EndDate,IsEnded),Area($select=AreaSK, AreaName, AreaPath, Number;$filter=AreaPath ne null),
AssignedTo($select=UserName;$filter=UserName ne null),CreatedBy($select=UserName;$filter=UserName ne null),ClosedBy($select=UserName;$filter=UserName ne null),ResolvedBy($select=UserName;$filter=UserName ne null)
&$filter=(AnalyticsUpdatedDate ge 2026-06-20Z)
&Top=10
Understanding the OData Query Structure
Think of an OData query as a URL that contains instructions for the ADO analytics to return the requested data. The base URL identifies the data source, while additional clauses, such as the filter, narrows the information to return. Every OData query begins with the endpoint and then adds instructions using query parameters.
The query structure follows a simple pattern:
ADO Endpoint = https://analytics.dev.azure.com/ADO-Org/TeamProject/_odata/v4.0-preview/
$select=...
&$expand=...
&$filter=...
The ? character starts the query.
Each & adds another instruction.
The most commonly used clauses are $select, $expand, and $filter.
$select: This clause Controls which fields are returned. Instead of retrieving every column from the WorkItems entity, specify only the fields needed for reporting. This benefits the query by having a smaller payload size which leads to faster refreshes and easier maintenance.
$expand: The $expand clause is similar to performing a join in SQL. It helps return fields from related entities such as Iteration Paths, Area Paths, Projects, and Users and the data is directly within the query result. This creates a denormalized dataset that closely resembles an Analytics View.
$filter: The $filter clause determines which records are returned and limits the number of records. Think of it as the equivalent of a SQL WHERE clause. This is important to fine tune the filter clause to reduce the number of records as the ADO analytics service will throttle your query if it is too large.
SEE this LINK for OTHER FILTER OPTIONS -> Add to GitHub
Why Use AnalyticsUpdatedDate to Filter?
Establishing the date field to use in the filter clause is one of the most important components to handle data refreshes. While CreatedDate initially appears to be a logical choice, it only represents when a work item was first created. Any future changes to that work item will not be detected if the record falls outside the original filter window. The AnalyticsUpdatedDate captures more events and indicates the last time the field is updated whenever Azure DevOps Analytics processes changes to a work item. Because Analytics Views are based on Analytics data, AnalyticsUpdatedDate aligns much more closely with how Analytics Views behave.
Even if Incremental Refresh is not configured in Power BI, using AnalyticsUpdatedDate improves report accuracy compared to filtering on CreatedDate alone. The AnalyticsUpdatedDate field exists across all the ODATA entities, making it a consistent field for querying data.
NOTE: This blog post uses a static date in the filter. For more advanced reporting scenarios, using AnalyticsUpdatedDate with a sliding date window provides the most reliable results. You could use the following to return the last 14 days of work items: AnalyticsUpdatedDate ge Today() – 14 Days
ADD the ODATA QUERY to the POWER BI REPORT:
Now that we have the ODATA query, it is time to add it to the Power BI report. Follow the steps in this blog post to add an ODATA query. It shows how to use the advanced ODATA options to add to the Power BI report to make it easier to troubleshoot or modify the ODATA query once added to the report. Or, use your favorite AI tool to convert the ODATA to Power Query, or M Code.
This is what Power BI uses to for data extraction and transformations. Here is the formatted ODATA converted to Power Query or M code:
let
 Source = OData.Feed(
 "https://analytics.dev.azure.com/Your ADO Org/Your Team Project/_odata/v4.0-preview/WorkItems?"
& "$select=WorkItemId,Title,WorkItemType,State,AnalyticsUpdatedDate,InProgressDate,CompletedDate,LeadTimeDays,CycleTimeDays,ProjectSK,WorkItemRevisionSK,AreaSK,IterationSK,Revision,Watermark,ChangedDate,CreatedDate,Reason,FoundIn,IntegrationBuild,ActivatedDate,Activity,BusinessValue,ClosedDate,Issue,Priority,Rating,ResolvedDate,ResolvedReason,Risk,Severity,StackRank,TimeCriticality,ValueArea,CompletedWork,DueDate,Effort,FinishDate,OriginalEstimate,RemainingWork,StartDate,TargetDate,ParentWorkItemId,TagNames,StateCategory,StateChangeDate,CommentCount"
&
 "&$expand=AssignedTo($select=UserName;$filter=UserName ne null)," &
 "CreatedBy($select=UserName;$filter=UserName ne null)," &
 "ClosedBy($select=UserName;$filter=UserName ne null)," &
 "ResolvedBy($select=UserName;$filter=UserName ne null)," &
 "Project($select=ProjectName,ProjectID,ProjectSK)," &
 "Iteration($select=IterationPath,IterationName,IterationSK,StartDate,EndDate,IsEnded)," &
 "Area($select=AreaSK,AreaName,AreaPath,Number;$filter=AreaPath ne null)"
&
 "&$filter=AnalyticsUpdatedDate ge 2026-06-20Z",
 null,
 [Implementation = "2.0",ODataVersion = 4]
 )
in
 Source
Data Transformations:
Date Modifications:
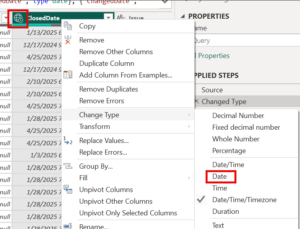
The date fields from the ODATA entities for ADO default to the DateTimeZone data type in Power BI. This means that they are UTC based and will include the number of hours from UTC in the field. This data type causes issues visuals in Power BI and should be converted to either Date or Date/Time. I find that converting to the Date datatype is most effective.

Either right click on the column header to change to the Date data type, or select the icon in the header to change the data type.
ANALYTICS UPDATED DATE FIELD:
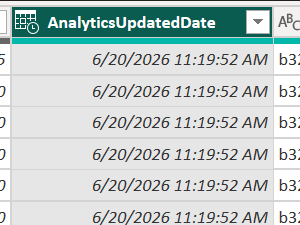
Unlike most date fields, the AnalyticsUpdatedDate is frequently used for incremental extraction and refresh logic. For this reason, it is recommended to keep AnalyticsUpdatedDate as a Date/Time field instead of converting it to Date. This field often becomes one of the most important columns in the data model when replacing Analytics Views.
EXPAND TABLES:
After loading the data, the expanded entities will appear as Record columns inside Power Query. These records must be expanded to expose the underlying fields. For example, the query clause &$expand=Iteration($select=IterationPath,IterationName,IterationSK,StartDate,EndDate,IsEnded) is a connection to the Iterations ODATA entity. It returns the values from the Iterations table on the same row as the work item data.
For each entity:
- Select the expand icon in the column header.
- Choose the desired fields.
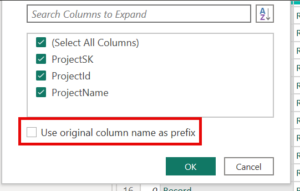
- Clear the option to use the original column name as a prefix if desired.
- Apply the changes.
Select the Expand option in the upper right of the column to open the dialog for each entity.

Unselect the checkbox to use the original name as a prefix and select the columns to add to the data model.
If you want to change the fields from the initial drop down, select the gear icon in the Applied Steps pane. This brings up the dialog.
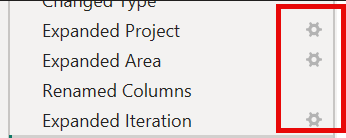
Rename the columns and change the data types as needed.
Handling Null User Values
Not every work item will contain values for AssignedTo, ResolvedBy, or ClosedBy. As a result, Power BI may generate errors when expanding user-related entities. The OData query attempts to minimize these issues through filtering, but null values can still occur.
The simplest solution is:
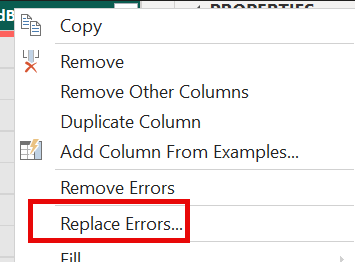
- Right-click the column.
- Select Replace Errors.
- Leave the replacement value blank.
This converts the errors to empty values.
Select Close and Apply to load the data into the Power BI data model and begin writing your reports!
GitHub Example Files:
The Power BI and ODATA example File are located here.