Tags are useful for categorizing and filtering work items in Azure DevOps. However, when you want to create Power BI reports based on the tags, you may encounter some challenges. For example, how can you count the number of work items with a specific tag, or how can you compare the tags across different work item types? In this blog post, you learn how to create a workitem tags table for Power BI reporting. This table will enable you to create more flexible and powerful Power BI reports with the tags data.
The Work Item’s Tags field in the Analytics Views is a comma delimited list when working with the field in the Power BI data model. It is possible to parse the list of tags with Power Query and DAX. To spare you the coding required, this blog post shows how to setup the work item’s tags as a separate table with a relationship to the Work Item table in Power BI. This makes reporting and DAX operations easier to create. Also, the Tag table can be used as a slicer in the reports.
As stated before, this blog walks you through the steps to create a table of tags and build a relationship to the work item table. Review this blog post if you need to create a calculated column to check for tags associated to a work item. The method is different as the calculated column is producing a Boolean value if a specific tag is associated to the work item.
Analytics Views Tag Field
Create and Analytics View and add the Tag field . Here is a screenshot of the Tags field in an analytics view.

Connect to the analytics view in Azure DevOps or import the data. This blog post describes the entire process if you have never created an Analytics View and connected to Power BI desktop.
Open Power Query editor using the Transform button on the Power BI desktop.
Transform the Tags Field
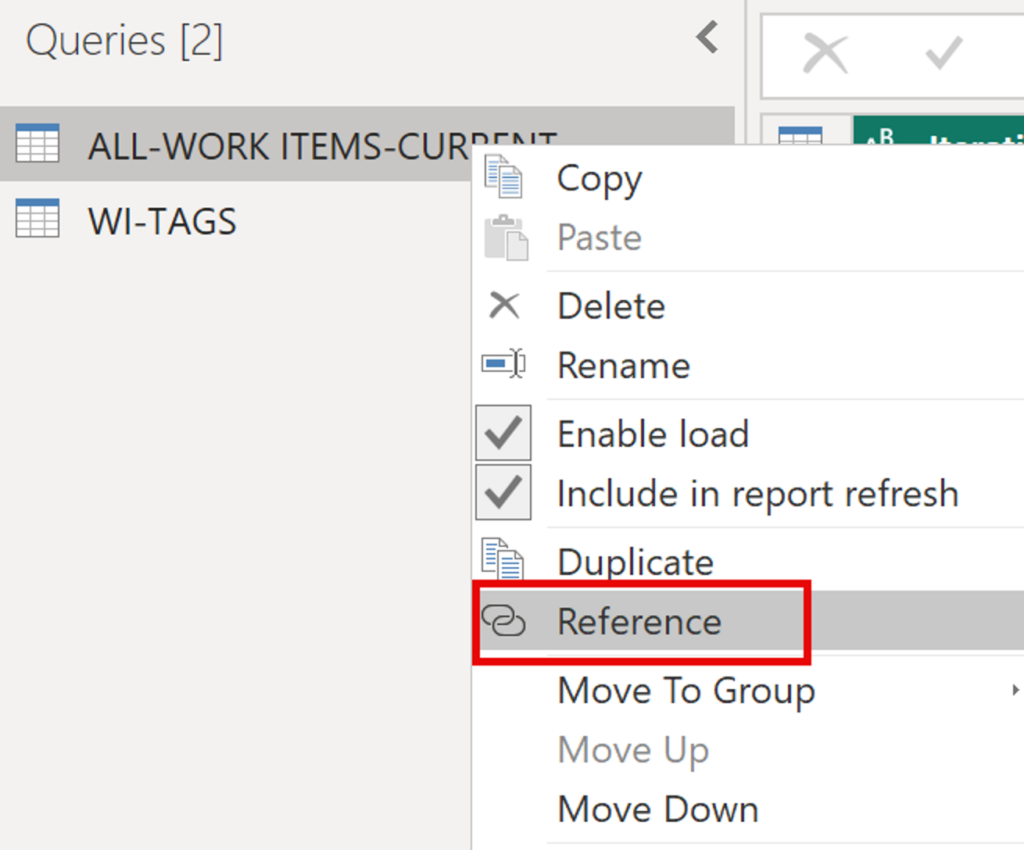
Select the Work Item table and right click and select Reference. This creates a copy of the Work Item table.

Remove all columns except for the Work Item ID and Tags columns.

Use the Split Column by Delimiter function on the Transform menu to extract the tags to new rows.

Select the Semicolon as the delimiter to use for splitting the Tags column.

Clean up the newly created rows of Tags by removing the training semicolon on some of the values. Use the Replace Values function. This is a two step process to removehte semicolon and null values from the column.

Remove null values and then filter on the empty rows to remove them. Or, just filter on the rows with null values. Your choice.


Select Close and Apply to load the data to the Power BI data model.
Create Relationship between Tables
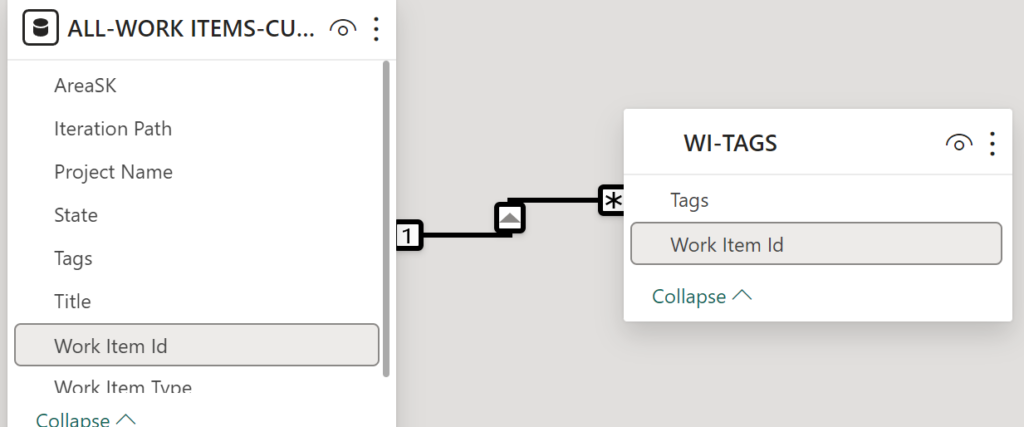
Open the Relationship view in Power BI desktop. There is a good chance the relationship was auto-detected.
If not, drag the Work Item ID field from the Work Item fact table to the WI-Tags table’s Work Item ID field. It should look like the following with a one to many relationship between the Work Item fact table and the WI-Tag table.

The steps to create the workitem tags table are easy to implement. Now, you can write the DAX code to count the number of tags per work item. Or determine if a work item has a tag with a simple lookup on the WI-Tags table!
Fini!