Create an Enterprise Dataset for Multiple Team Projects
ADO users commonly write work item queries to construct dashboards or export data to Excel for reporting. Converting these queries into analytic views as the primary source of reporting on work items is a straightforward process. Analytic views leverage the ADO analytics service, emphasizing performance in data retrieval and reporting. The issues arises when trying to merge multiple analytics views into a single Power BI table for reporting. The following blog post will show you how to create an enterprise Azure DevOps report with Analytic Views by querying across the ADO Team Projects and Organizations.
This approach actively addresses the challenge of merging multiple Analytics Views from within the same team project or across different ADO organizations into a unified table view. This is also referred to as cross organization or enterprise reporting for work items. This unified table of work items serves as the foundational data source for Power BI visuals and calculations, enabling the presentation of data in Power BI to surpass the capabilities of work item queries and dashboards, delivering a more compelling narrative.

IMPLEMENTATION:
There are several ways to create the data model with analytics views (AV) and Power BI. There is not a right or wrong approach. It all depends on what best meets the needs for your team and the type of reporting to be completed.
The first, and recommended approach, is to create a single AV with multiple team projects. This approach is the easiest to maintain and only requires one connection from the Power BI report to the ADO AV.
The second method is to create an AV in each team project within the ADO organization and ensure the fields match. Use the steps listed below to merge the AVs together to create a single table. This method requires more maintenance as an adjustment of fields or filters in one AV is required to be completed on all AVs.
The third option is to create an AV with one or more team projects data in ADO organization and use the steps to merge into a single table. This allows for cross-organization reporting by allowing you to report on work items from different ADO organizations.
NOTE: There is an investment in time to create and transform the Avs. However, it is a one-time setup of the data into Power BI and provides you with work item data to use in the visuals.
CREATE an ENTERPRISE ANALYTIC VIEW
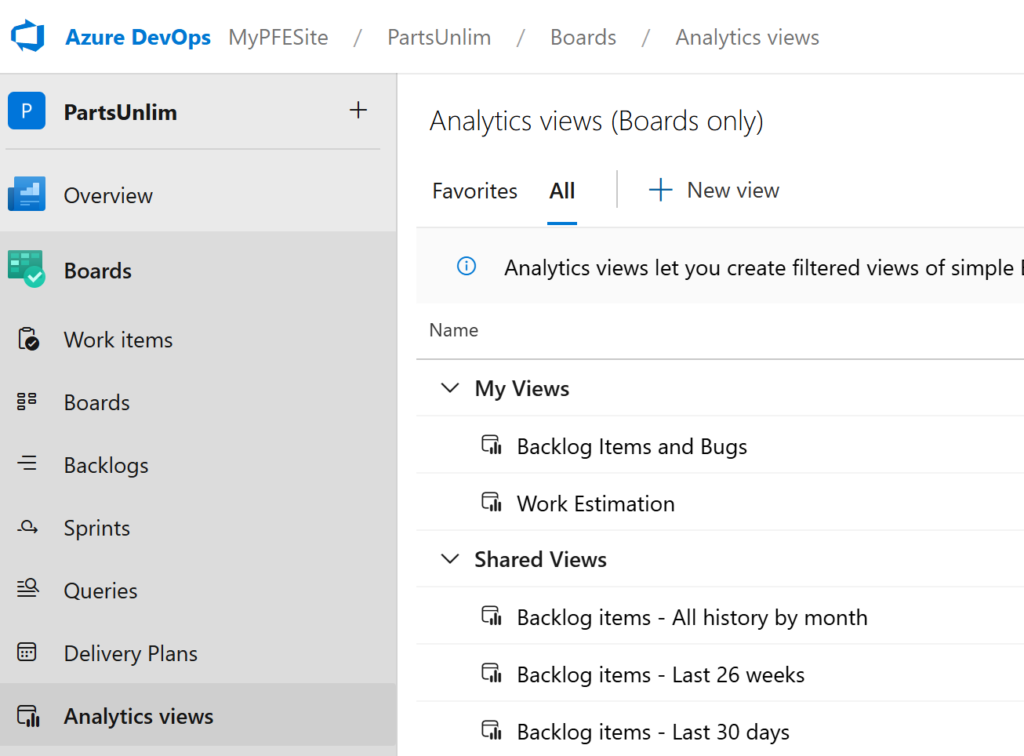
An Analytics View allows for filtering the work items at the team, or team project level. For this situation, we are filtering at the team project level. As an example, if you have five team projects in the ADO org and wanted to combine the work items from all five team projects, then five AVs are required. It is best to ensure AVs are almost identical in the configuration to minimize issues when combining the queries. Only include the fields needed in the reporting. This enables faster loading of the data as well as more performant data model in the Power BI report. This blog post explains how to create an Analytic View and connect to Power BI.
To create an Analytics View for all work items in the team project, select the All Teams value in the Teams option. The Project drop down allows you to select the Team Project.

WORK ITEM SELECTION:
Only add the Work Item types that are needed in the report. DO NOT ADD ALL Work Item fields. This will bloat the data model and cause performance issues in Power BI.
These are the fields included in the AVs used in these instructions. Your selection of fields will be different.

NOTE: It is highly recommended to limit the number of work items returned in the AV for performance on the data load. Use the Filter option to limit the type of work items based on their state or other fields. The AVs are not the most performant analytic method to extract the data from ADO. However, they are the easiest to setup and maintain. Be realistic on the performance of the data refresh if there is a high number of work items being loaded into the Power BI report.
In the History tab, select the Current Only option.

Select Save and close the AV.
NOTE: The configuration between the AVs should be close to identical.
Repeat steps to create the AVs for each of the team projects. It is best to create all of the AVs in a single team project to make it easier to connect from Power BI.
CONNECT to the AV from POWER BI
Create a new Power BI Desktop report
Select Get Data -> More -> Online Services
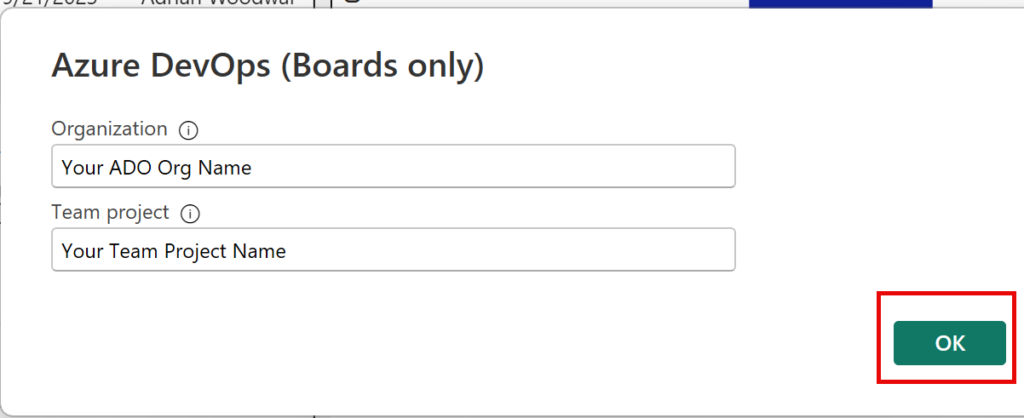
Select Online Services -> Azure DevOps (Boards Only)

Enter your ADO Organization and Team Project names. Click here if you do not know these values.

Expand My Views
Select all of the Analytics Views created in the earlier steps.
Select Transform
The Power Query Editor opens and transformation of the data is completed in this window before loading the data

TRANSFORM QUERIES
These steps show how to transform the date fields before merging the queries. This helps reduce updates to the queries at a later time.
Select Detect Data Type

Change the datatype for any Date field, such as Iteration Start and End date. Change from Date/Time/Timezone to Date/Time. If you don’t need the time value, then change to just Date.

Repeat these steps for each Team Project’s AV.
Merge Analytics Views to a Create a Single Table
The following steps produce the end produce. A single table to use for the source data in the Power BI report. It is much easier to write calculations and visual the data using a single table for ALL the work items.
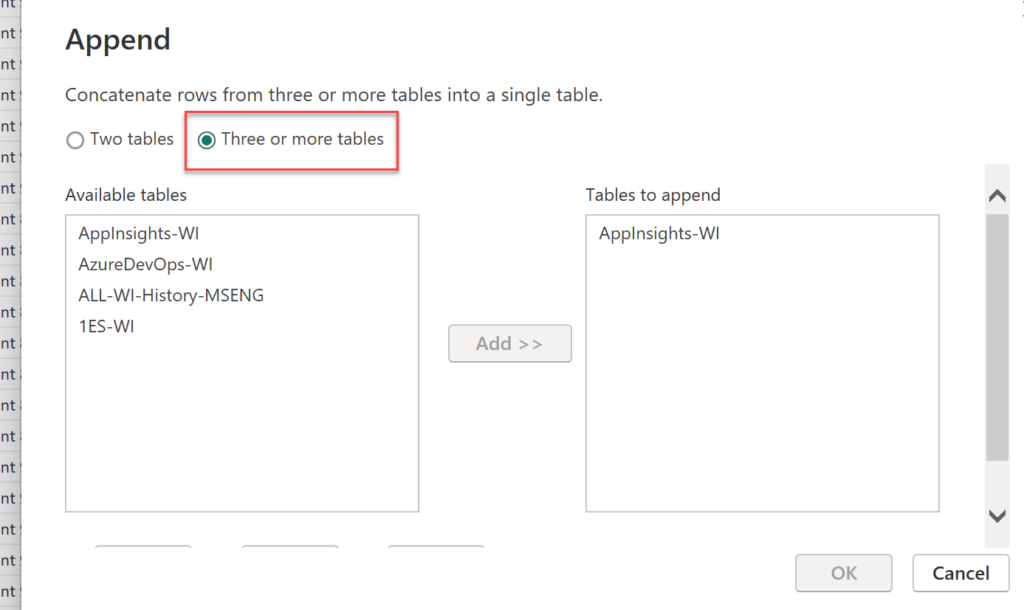
In Power Query editor, select Append Queries -> Append Queries as New

Select the Three or more Tables if there are > two AVs, or tables, to append.

Select the other tables to append.
Rename the newly created table.
Select Close and Apply.
The data will load from the Avs into the Power BI dataset.
NOTE: Set expectations for the load time of the Avs if there are a large number of work items to load.
Hide Tables after Merging the Analytics Views
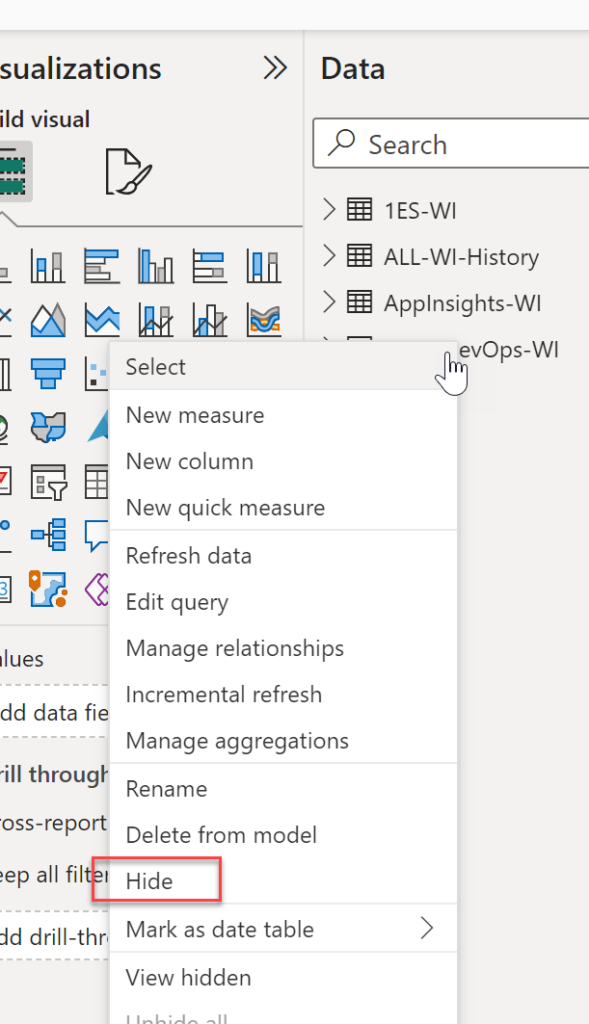
Once the data is loaded into Power BI, hide the other AVs, or tables, and expose only the combined table. Hiding the other tables limits the chances of using an incorrect table in the report and reduces confusion.

For each of the source AVs, right click on the table and select Hide.
This leaves the appended table as the one table to use in reporting.

The table is now ready to use in the Power BI visuals!
Select Close and Apply to update the data.