Easily Create a Single Table Data Model for Effective Reporting
To create an effective ADO report, you don’t need a complex data model if your goal is to provide summary information. Using an Analytics View is the easiest way to start reporting, as it includes most of the necessary details about work items. Additionally, it encompasses information about iterations, area paths, team projects, and users. This is called a composite data model as it retrieves data from other analytics tables and displaying it in a single result set. The data model discussed in this blog post consists of a single table, but you can add a calendar table if you need to perform time-based calculations. These steps will allow you to easily create a single table data model report in Power BI.
The easiest method to being reporting on ADO workitems is using an Analytics View. Follow the steps in this blog post to create an Analytics View and connect to the Power BI report. If you need to create a report on multiple team projects in ADO, check out this blog post. It walks you through the steps to create an enterprise level report.
You can use an ODATA query instead of the Analytics Views as the ADO data source for the fact table of workitems. Review this blog post on how to include the iteration, area path, and other entities using the $expand clause to create a single table result set.
Either the ODATA query or the Analytics View serves as the fact table in the data model. The data model will have either a single fact table, or an additional calendar dimension table. That is all you need to get started with reporting with ADO data in Power BI.
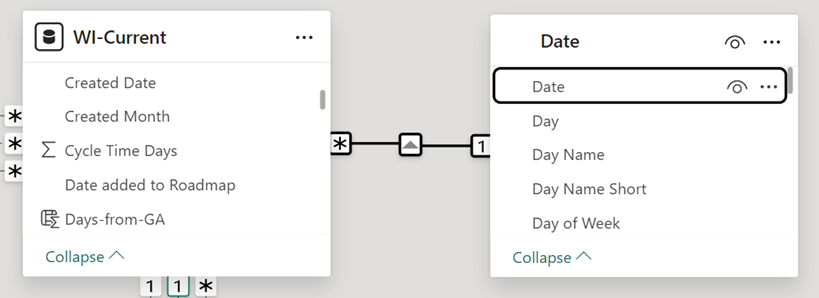
Add a Calendar Table
Integrating a date table in Power BI is essential for generating reports that offer a thorough analysis of work items, pipelines, and testing in Azure DevOps (ADO). A date dimension is a table featuring one record per day, allowing the creation of measures that analyze data by various date attributes like week number, fiscal period, and day of year, among others. This capability enables the development of custom metrics tailored to your team’s processes, such as lead and cycle times or burn down charts. Additionally, it ensures consistency in analysis and simplifies the creation of trend reports on work items, pipelines, or testing data from ADO.
This blog post shows how to add a date table to data model to enable time-based reporting. The process is straightforward and only requires running a script to add the table and connect in the data model’s relationship window.
Publish the Report and Schedule the Data Refresh
Is your report ready for an audience? This blog post goes through the steps to publish the report, set the data source credentials, and setup the data refresh process.