Visualizing ADO Workitems in a Hierarchial Data Model
To effectively visualize the hierarchical structure of work items in Azure DevOps (ADO) within Power BI, you need to create a data model that mirrors ADO’s inherent structure. This involves linking work items through their Workitem ID and ParentworkitemID fields, establishing a parent-child relationship. The hierarchy starts at the top with work items like Themes or Epics and cascades down to the lowest level, such as Tasks. The primary objective of this data model is to enable cascading visuals in Power BI reports, which is particularly useful for viewing top-level work items like Epics and their associated child work items, such as User Stories.
While a single fact table can achieve this, challenges arise when the report needs to display work items that are more than one level apart, such as Tasks linked to a Feature or Epic. These relationships, considered grandparent to grandchildren work item relationships, require additional steps to connect the work items in the Power BI data model.
This hierarchical waterfall data model addresses this challenge by allowing the display of a parent work item along with multiple levels of child work items in a single report. It also includes rollup metrics from the child work items to the parent. The child work items can be several levels deep, requiring relationships between various work item type tables to complete the calculations. This blog will guide you through retrieving the work item data, creating the necessary relationships, and performing basic calculations.
Challenges with the Data Model:
A cascading data model in Power BI can present several challenges. One significant issue is dealing with unparented workitems, which can cause null values to be returned in calculations. This can lead to unpredictable results, such as incorrect counts of workitems. Additionally, maintaining relationships between tables can be complex, especially when workitems are associated with multiple parents or when there are non-parented workitems. These relationships need to be carefully managed to ensure accurate data representation and calculations. The steps in this blog attempt to address some of these challenges through the DAX measures for the summary, or rollup calculations.
Implementation:
The next section describes the process to retrieve the work items through either an Analytics View or an ODATA query. This is followed by the steps to establish the data model relationships, and finally the DAX measures for the calculations.
Data Source:
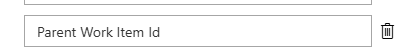
This report implementation can use either an Analytics View or an ODATA query for each of the workitem types. If using an Analytics View, either create a view for each work item type and ensure the Parent Work Item ID is a field in each view. The Parent Work Item ID field is the key value that links the tables together.
Analytics Views:
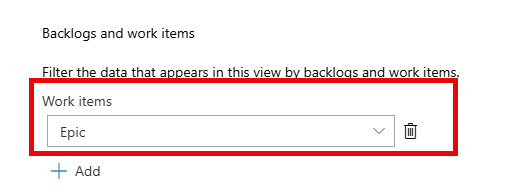
To use a set of Analytics Views as the source for work items, follow the steps outlined in the blog post on creating and connecting them to the Power BI report. Unlike work item queries, Analytics Views cannot be cloned, so you’ll need to select the same fields for each view. The main difference lies in the work item type within the Backlogs and Work Items section of the designer. Start by filtering the top-level work item type for the initial Analytics View, then create additional views for the lower-level work item types.
After creating the Analytics Views, connect them to the Power BI report and refresh the data. Follow the steps in the blog to connect to the Power BI report.
ODATA Query:
If you are unfamiliar with creating and running ODATA queries, check out this blog post and this online help file for tips to get started. ODATA provides flexibility in the creation of the queries to retrieve the ADO data and can be used outside of the Power BI semantic model.
Here is a basic ODATA query to return Epic workitems created after 1/1/2023. Add your ADO Organization and Team Project in the URL where the brackets are located.
Remove the &$top=100 after testing in VS Code and the query works. Follow the steps in blog post to run the query in VS Code and to add to the Power BI report.
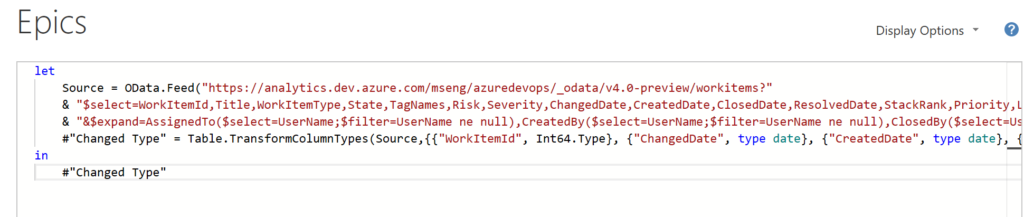
https://analytics.dev.azure.com/<Your ADO Org>/<Your Team Project>/_odata/v4.0-preview/workitems?
$select=WorkItemId,Title,WorkItemType,State,TagNames,Risk,Severity,ChangedDate,CreatedDate,ClosedDate,ResolvedDate,StackRank,Priority,LeadTimeDays,CycleTimeDays,ProjectSk,ParentWorkItemId
&$filter=(CreatedDate ge 2023-01-01Z) and (WorkitemType = 'Epic')
&$top=100
NOTE: The most important field is the ParentWorkItemID. This must be in each query for this data model to work.
To generate your report, create a query for each type of work item in the hierarchy, including Features, User Stories, and Tasks.
You will need to authenticate to ADO using either a PAT token or use your Organizational Account.
How to Duplicate the ODATA Query:
The easiest method to create multiple queries is to duplicate the first query.
Open Power Query Editor -> Select Transform Data on the main menu.
Power BI will select the Date/Timezone data type for all date fields. I normally change the data type to Date. You don’t need a time value for these fields.
Complete all the transforms on the dataset.
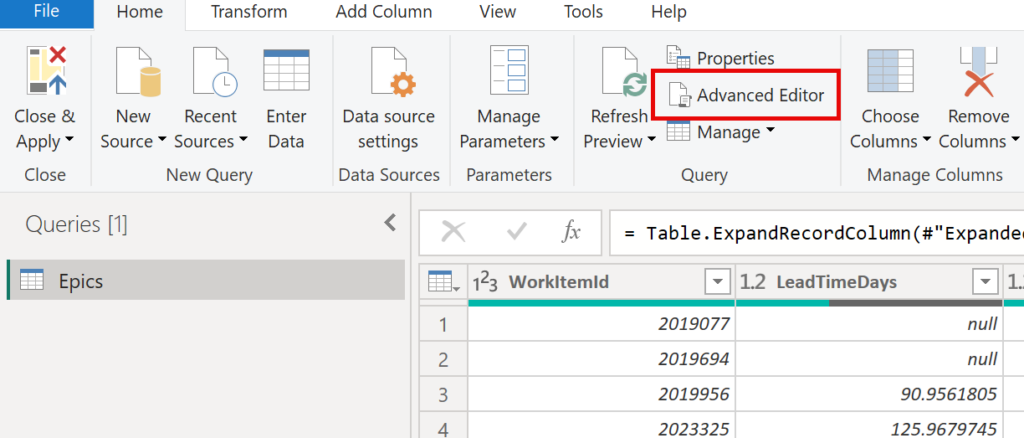
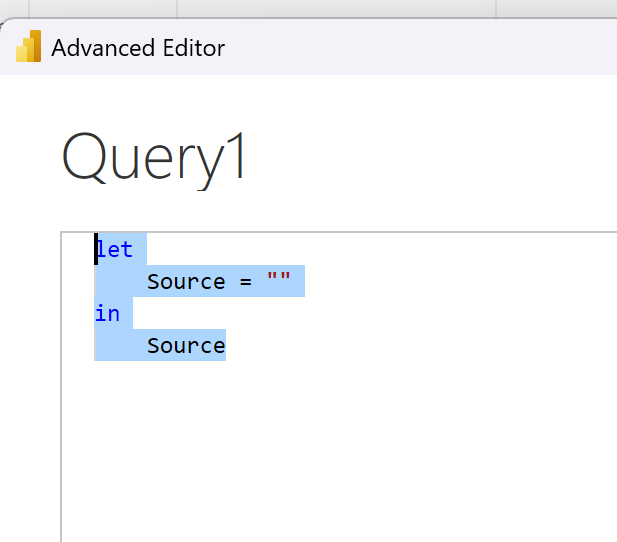
Highlight the first query, and select the Advanced Editor button
Select all the text in the editor and select Copy.
Select Cancel to close the editor.
Create the new query by selecting New Source -> Blank Query

Select the Advanced Editor button to open the editor
Highlight the existing text and select Paste to overwrite the contents.
Change the workitem type in the Filter clause. This example shows the change to a Feature.
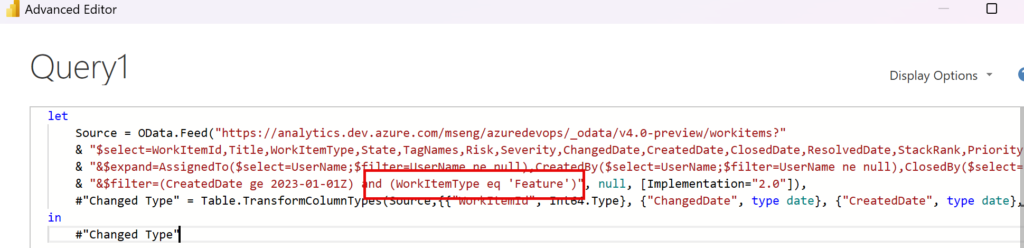
Select Done and close.
Rename the table to appropriate workitem type.
Do the same for the other workitem types until you have all the workitem types for the report.
Select Close and Apply to load the data.
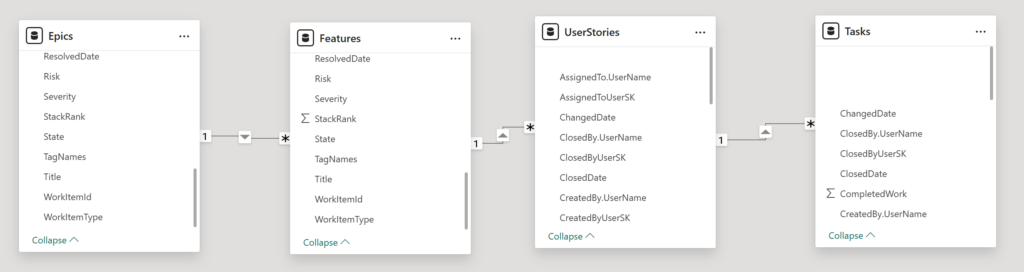
Data Model Relationships
Power BI excels at identifying relationships between tables, but it doesn’t automatically understand the hierarchy based on workitem types. To achieve this, you need to arrange the tables in a waterfall flow, starting from the highest level workitem to the lowest. This can be done using the ParentWorkitemID and WorkitemID fields.
Select the Relationship view in Power BI desktop and arrange the tables according to their hierarchical order in ADO.
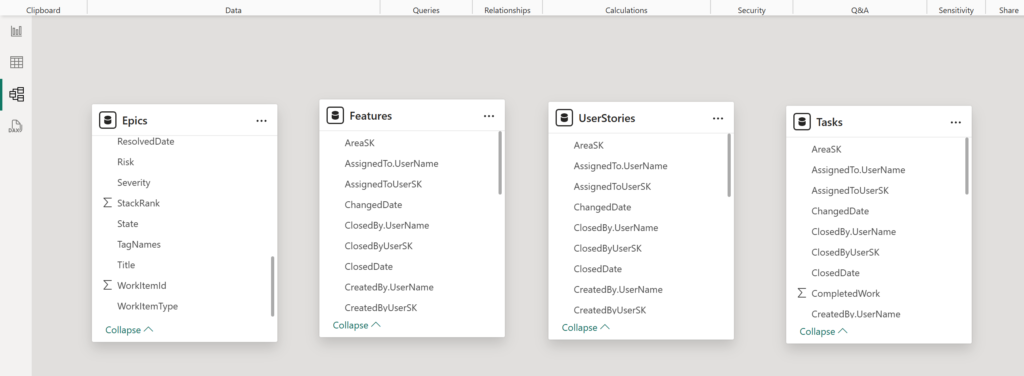
Starting with the Epics table, drag the WorkitemID field to the Feature’s ParentWorkitemID field to create a one to many relationship.

Continue the process with the Feature and User Story table. Finish with the relationship between the user story and the task table. Each table will have a one to many relationship between the parent and child tables.
Test the Relationships
To test the relationships are working, add a table for each of the workitem types. Add the ParentWorkitemID field to the lower level workitems and the count for the workitems.
In this report, the Epic 2215732 is selected. The value is the parent workitem ID in the Features table. The Feature workitem ID 2212987 is the Parent workitem ID to the User Story 2213734. These tables show the children to the parent Epic workitem. The relationship flows through the table.
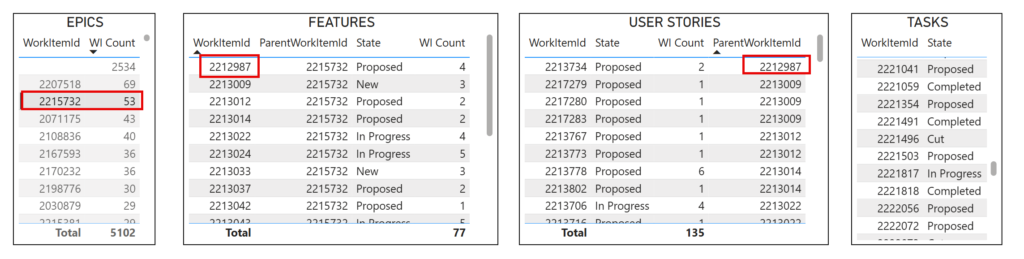
This allows you to create reports where the parent workitem, such as an Epic or Feature can be displayed along with the children User Stories and Tasks.
DAX Measures and Calculations
The following DAX measures count the total and open workitems at each level in the hierarchy and provide a % complete value.
Total Task Count:
Task-Count =
var _wiCount = CALCULATE(
                              COUNTROWS('Tasks'),
                                Not('Tasks'[State] in {"Cut"})
                            )
var _returnValue = IF(ISBLANK(_wiCount),0,_wiCount)
return _returnValue
Open Task Count:
Task-Open-Count =
var _wiCount = CALCULATE(
                                COUNTROWS('Tasks'),
                                Tasks[State] in {"In Progress","Proposed","Committed"}
                            )
var _returnValue = IF(ISBLANK(_wiCount),0,_wiCount)
return _returnValue
Total Remaining Work for Tasks:
Task-Remaining-Work-Total =
//Sum the total Completed Work for the Tasks
var _totalWork = CALCULATE(
                            SUM('Tasks'[RemainingWork]),
                            not('Tasks'[State] in {"Cut"})
                            )
return _totalWork
User Story Count:
UserStory-Count =
var _wiCount = CALCULATE(
                                COUNTROWS('UserStories'),
                                not('UserStories'[State] in {"Cut"})
                            )
var _total = IF(ISBLANK(_wiCount),0,_wiCount)
return _total
Open User Story Count:
UserStory-Open-Count =

var _wiCount = CALCULATE(
                    COUNTROWS('UserStories'),
                    not('UserStories'[State] in {"Cut","Completed","Cut"})
                            )
var _total = IF(ISBLANK(_wiCount),0,_wiCount)
return _total
User Story Completion %:
UserStory-All-Workitems-Completed-% =
//Calculate the tasks completed for the user story
var _taskTotal = [Task-Count]
var _taskOpen = [Task-Open-Count]

var _taskCompleted = _taskTotal - _taskOpen
var _percentComplete = DIVIDE(_taskCompleted,_taskTotal,0)

return _percentComplete
For the Features and Epics, use the measures for the Task and User Stories to calculate the % completed.
Feature-All-Workitems-Completed-% =
//calculate the total number of workitems completed that are under this WI
var _userStoryCount = [UserStory-Count]
var _userStoryOpen = [UserStory-Open-Count]
var _taskCount = [Task-Count]
var _taskOpen = [Task-Open-Count]

var _totalWI = _userStoryCount + _taskCount
var _wiOpen = _userStoryOpen + _taskOpen
//Calculate the total number of workitems that are closed
var _totalWIClosed = _totalWI - _wiOpen
// Calculate the percentage of workitems that are closed
var _percentComplete = DIVIDE(_totalWIClosed,_totalWI,0)

return _percentComplete
Repeat the pattern for the measures to the Features. Add an Open and Total count measure on the Features table.
The code for the Epic completion % uses all three levels of workitems for the calculation.
Epic – Total Workitem Count:
Epic-All-Workitem-Count =
//Count the features, users stories,and tasks associated to the Epic
var _featureCount = [Feature-Count]
var _userStoryCount = [UserStory-Count]
var _taskCount = [Task-Count]
// Calculate the total number of workitems associated to the Epic
var _totalCount = _featureCount + _taskCount + _userStoryCount

return _totalCount
Epic – Workitem Completed Count:
Epic-All-Workitem-Completed-Count =
//Calculate the percentage of completed workitems
var _totalWI = [Epic-All-Workitem-Count]
var _userStory = [UserStory-Open-Count]
var _features = [Feature-Open-Count]
var _tasks = [Task-Open-Count]
var _totalOpen = _userStory + _features + _tasks

var _completedWI = _totalWI - _totalOpen

return _completedWI
Epic – Completed % – All Up
Epic-All-Completed-% =
//Calculate the completed % for all workitems
var _totalWI = [Epic-All-Workitem-Count]
var _completedCount = [Epic-All-Workitem-Completed-Count]
//Calculate the percentage of workitems that are completed
var _percentDone = DIVIDE(_completedCount,_totalWI,0)
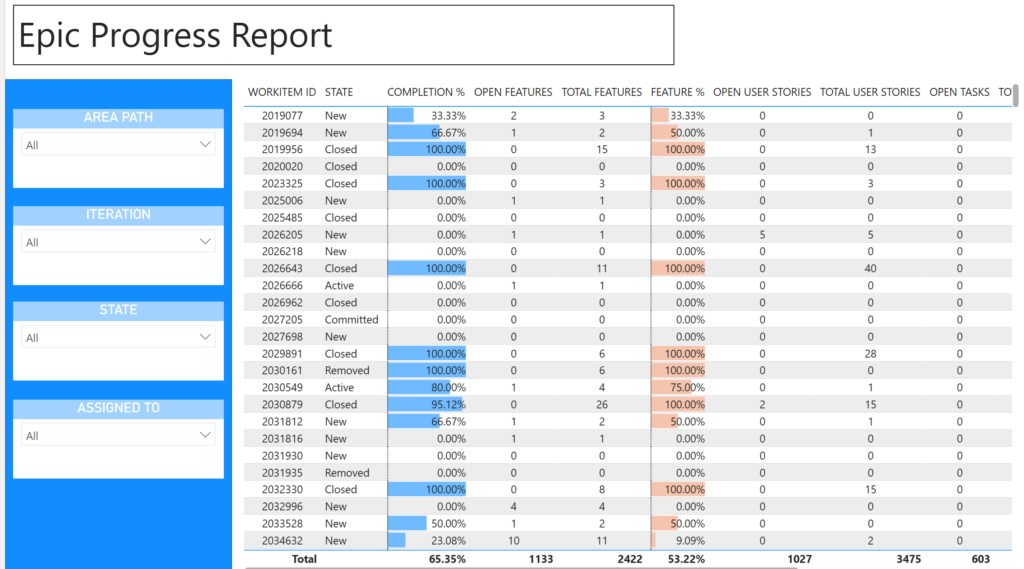
return _percentDoneExample Report
This is an example of the type of report you can create with the data model and the DAX measures. This rolls up the completion rate from the Tasks to the Features and provides a quick visual on the progress of the Epics.