Using an Analytics View as the Source for your ADO Report
The simplest way to start reporting with Power BI is to use an Analytics View as the source for Azure DevOps work items. Analytics Views are easy to create and manage. However, some parts of the UI wizard need extra explanation to make sure the view shows the right data. This blog post goes over the steps to create an Analytics View and connecting to a Power BI report with the latest work item data. This means that the report will display the work item values that match what you see in the web browser for Azure DevOps.
Creating the Analytics View:
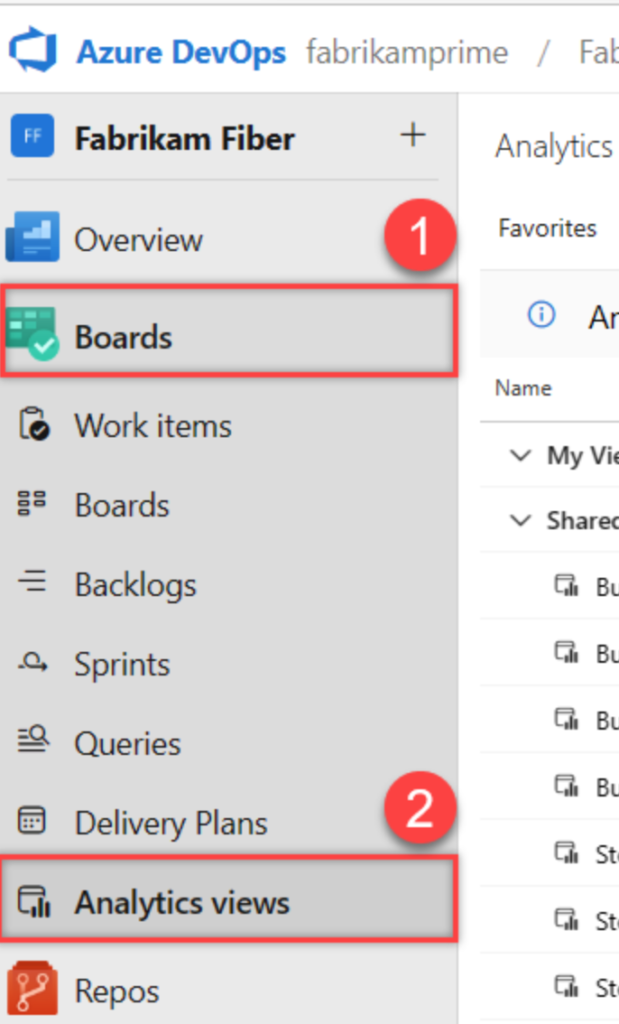
From your web portal, select Boards > Analytics views.
If you don’t see Analytics views, check that you have permissions to view Analytics. See the Permissions and prerequisites to access Analytics.
GENERAL TAB:
In the General tab of the wizard, name the view. During the development phase of the Power BI report, keep the view private. Once the report is published to the Power BI service, change the permissions to Shared. Otherwise, the report will fail on the refresh of data in the Power BI service.
NOTE: All members of the Contributors group for your project can use Shared views in Power BI. For shared views that you create, you can manage the permissions of users and groups to create, delete, or view a specific shared view.
WORK ITEMS TAB:
In the Work Items tab, select the team project or team as the source. The recommended approach is to use a team project to return the most work items possible for your report. You can add multiple team projects to a single analytic view. This process enables you to create rollup reports across the Azure DevOps organization.
Apply a filter to limit the number of team projects during the development phase of the report. An applied filter will limit the work items on the initial load and speed up the report design process. The filter can be removed at a later time.
Select the work item types or the backlog level to return for the data source.
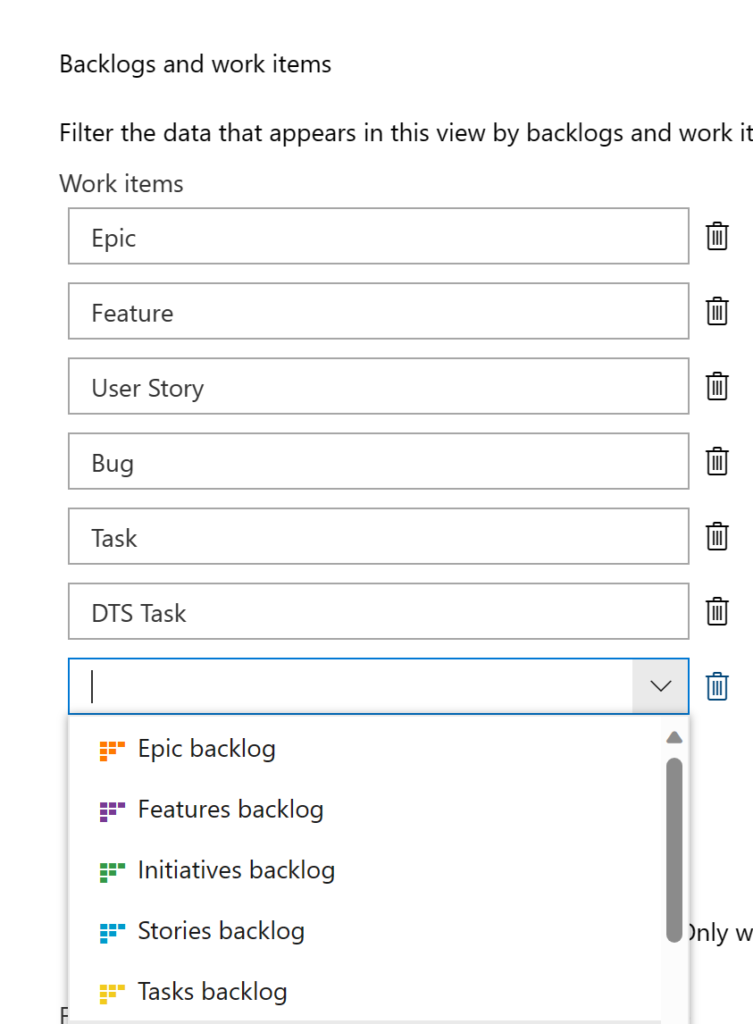
NOTE: The backlog level selection will include bugs in your analytic view if configured.

Apply filters to return the exact type of work items based on state, tags, area paths, etc. Reduce the fields and the number of work items to ensure your reports are performant. There is no need to return work items that will not appear in the report calculations.
FIELDS:
Limit the fields needed in the report’s calculations and visuals. You can always go back and add fields to the analytic view if they are required for the reports.
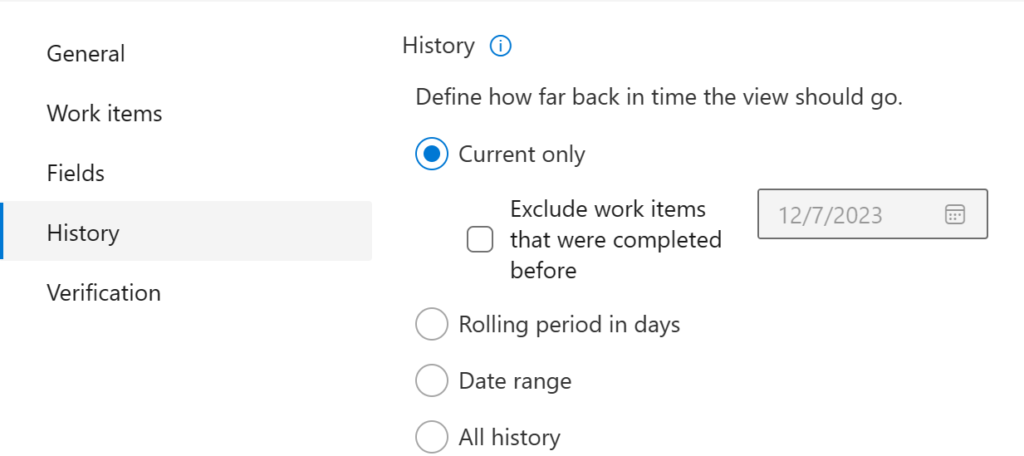
HISTORY:
The example report uses current work items. Select the Current Only option to return the latest value of the work item. What appears in the Azure DevOps UI should match the report.
Save the view and provide a descriptive name.
Connect to the Analytics View from Power BI
Open Power BI.
Select Get Data -> More
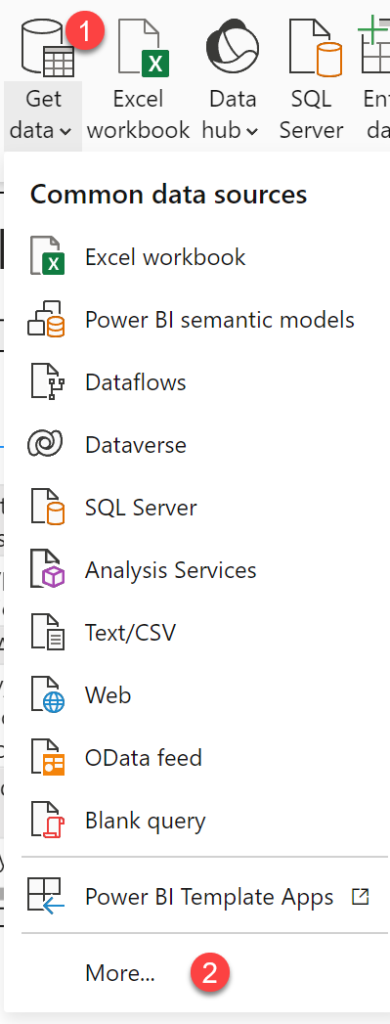
Select Online Services -> Azure DevOps (Boards Only) -> Connect
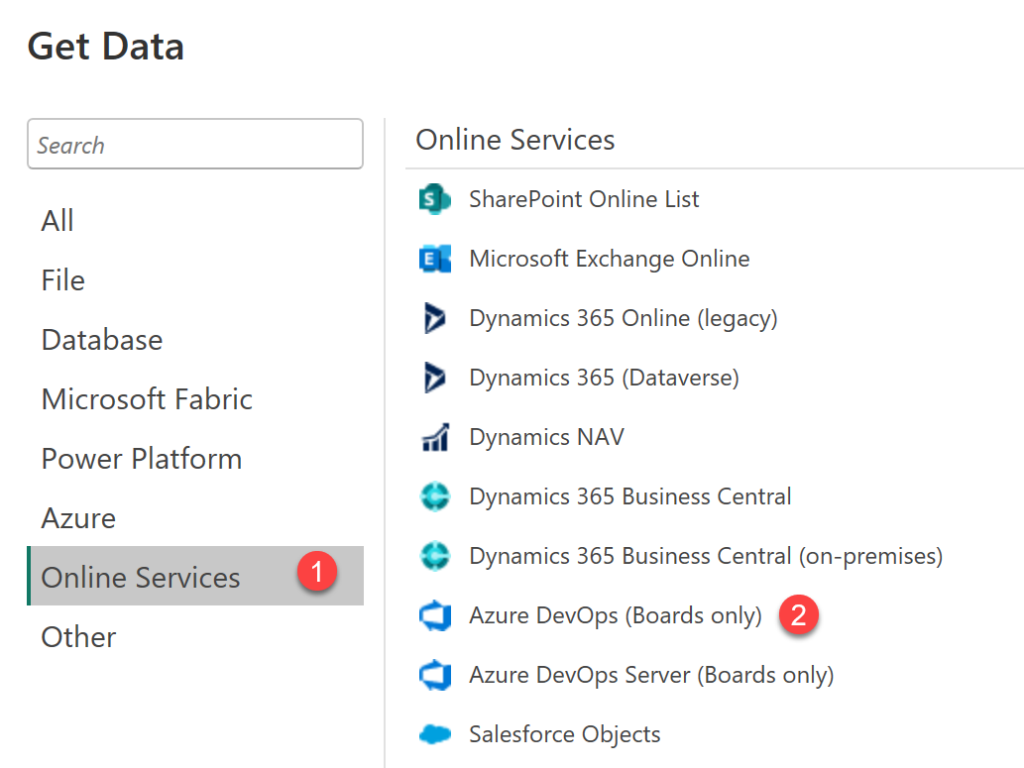
Enter the name of the ADO Organization and the Team Project where the analytic view is saved. Select the help icon next to each field for additional information.

You may be prompted to enter your organization account credentials to authenticate to the Azure DevOps site.
Select the analytic view from the My Views if it is set to private. Otherwise, the view will appear in the Shared Views folder.
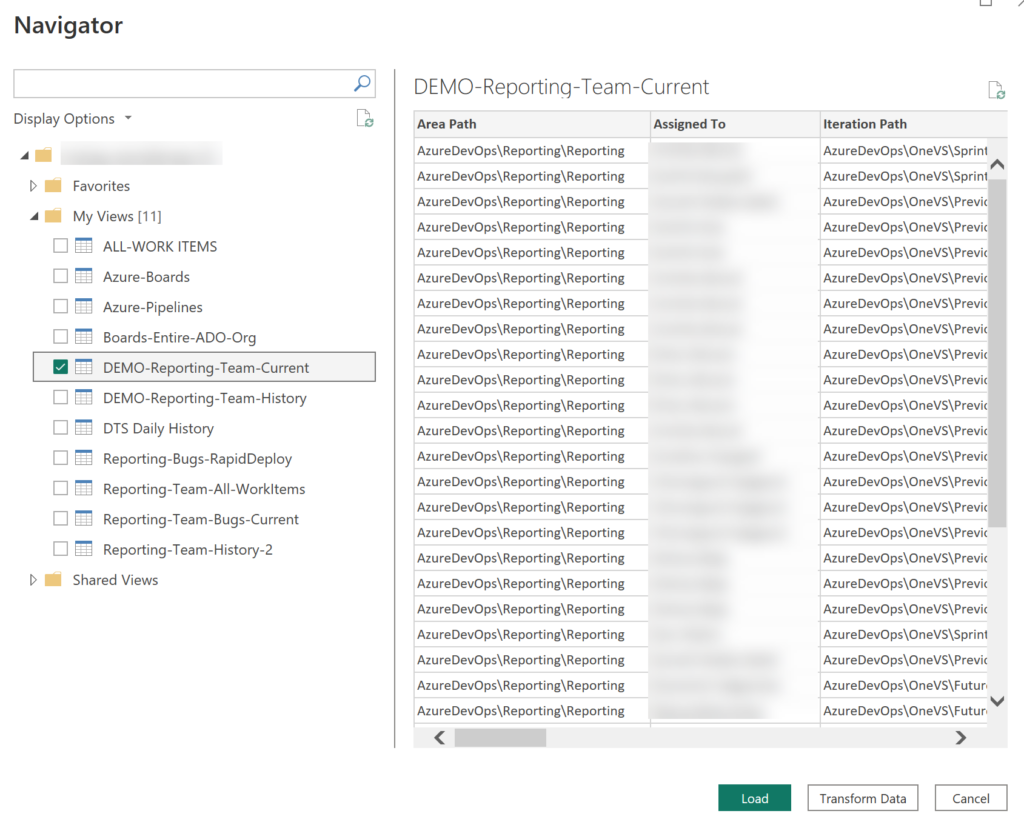
Select Load and the work items are imported into Power BI.
Once loaded the analytic view appears in the Data tab in Power BI. The fields are ready to use in the report visuals.
Select Close and Apply to load the data from the analytics view. The data is now ready to use on the report canvas.
fini!