The Benefits of Using Analytics Views for Power BI Reporting
In the ever-evolving landscape of software development, the necessity to promptly and comprehensively monitor project progress is paramount. The integration of Azure DevOps with Power BI reporting, specifically through the utilization of analytic views, presents a straightforward solution for observing both the active and historical states of work items. Analytic views within Azure DevOps act as a catalyst for creating Power BI reports, enabling a comprehensive overview of your project’s status and facilitating the tracking of both active and historical states of work items. This blog post delves into the pivotal advantages of employing analytic views while also addressing their limitations.

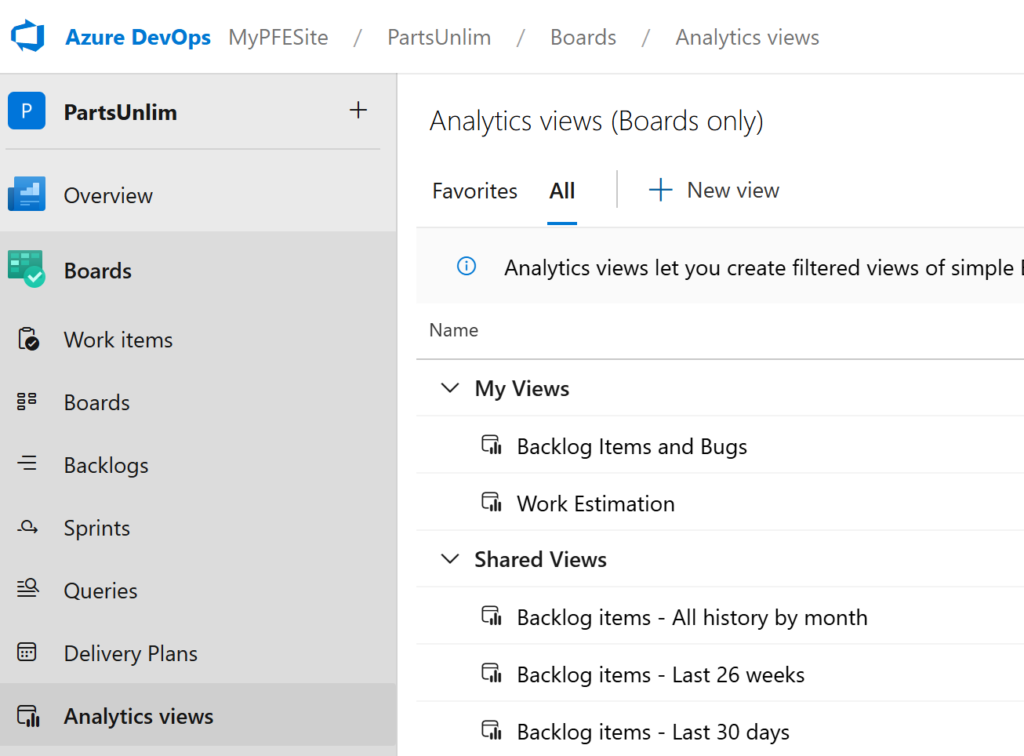
An analytic view streamlines the specification of filter criteria for Power BI reports based on work items listed in the Boards hub. Each view corresponds to a flat list of work items, normalizing the data to support reporting on “many-to-many” relationships, such as those between work items and associated tags. While this simplifies report creation by eliminating the need for table relationships, it restricts the creation of hierarchical reports (e.g., Features -> User Stories -> Tasks) without resorting to DAX queries or alternative methods.
The user-friendly analytic view interface simplifies the creation process, ensuring accessibility for users with varying technical expertise. This feature promotes swift adoption across teams, reducing the learning curve and enabling quick initiation into Power BI reporting. The steps in the ADO UI are easy to learn and implement, eliminating the need for SQL-like syntax knowledge to use ODATA queries. Most of the online examples from Microsoft focuses on the use of the ODATA queries and this discourages users from creating reports. Users can seamlessly integrate ODATA queries into Power BI for augmenting missing work item data or incorporating additional information like iterations or area paths.
Limitations:
As mentioned earlier, work item hierarchies are not supported. Strategies to overcome this limitation are outlined in a future blog post.
Analytic views do not support reporting on long text fields like Description or History and HTML fields. Addressing this limitation involves adding such data to the report using API calls and appending it to the analytic view data – a topic to be covered in a future blog post.
Another consideration is that the Azure DevOps permission model is not enforced in analytic views. Organizations need to be prescriptive in managing work item data to prevent unauthorized access. Addressing this gap involves establishing robust access controls within Power BI to compensate for the absence of Azure DevOps permission enforcement.
Conclusion:
Using Analytic views as the data source for Power BI reports opens the door to efficient reporting for Azure DevOps work items. Analytic views offers numerous advantages alongside essential considerations. While the absence of Azure DevOps permission enforcement in analytic views poses a challenge, implementing robust access controls within Power BI can effectively address this issue. The user-friendly interface and the ability to initiate reporting without complex SQL syntax contribute to the attractiveness of analytic views, positioning them as a valuable tool for being the data source for work item reporting.