Optimize the Power BI Report with a Star Schema Data Model using Analytic Views or ODATA
Using a star schema data model in your Power BI report to link iterations and area paths to the work items fact table offers several benefits. This schema enhances data integrity by ensuring consistency and reducing redundancy, and it is scalable, allowing for easy addition of new dimensions. It also facilitates better data analysis with drill-down capabilities and comprehensive insights and provides a user-friendly structure that makes reporting more intuitive and interactive. Optimize your ADO reports with a star schema data model in Power BI by making your data model more efficient, scalable, and user-friendly, enhancing both performance and user experience.
Enhance the Analytic Views with ODATA
Analytics Views in Azure DevOps (ADO) serve as a powerful data source for Power BI reports, offering detailed insights into project performance, work items, and team dynamics. Use them to monitor sprint progress, spot bottlenecks, or assess contributions, all while benefiting from their seamless integration with Power BI to improve your reporting.
However, Analytics Views have some limitations that may require you to supplement them with other data sources. For example, Analytics Views does not display all iterations and area paths within a team project. They only reflect those iterations and area paths actively being used for planning. It also does not show the teams associated with each iteration or area path.
Utilizing OData queries provides access to ADO entities and details that are not accessible via Analytics Views. OData allows for the extraction of iteration paths, iterations, users, along with their metadata and relational data within your project. To correlate these tables effectively, the Power BI report must have a well-defined data model.
By integrating Analytics Views with ODATA queries, you can construct a data model that adheres to the principles of a star schema.
Steps to Create the Star Schema Data Model
The steps in this blog connect an Analytics View to a series of ODATA queries that retrieve iterations, area paths, team projects, and users. After importing the data into the report, connections are created linking the dimension tables with the fact table, specifically the work items table. This setup allows the DAX measures to leverage the Power BI relationships for carrying out calculations and applying filters within the visuals.
The Workitem Fact Table – Analytics View or ODATA
The workitem fact table is the central table in the Power BI report. This table contains the workitem types for the report. The source of the workitems can come from an Analytics View or an ODATA query. If you are just getting started with reporting, or have a non-complex report, start with the Analytics View.
Analytics Views
Follow the steps in this blog to create an Analytics View and connect to the Power BI report. Be sure to include the IterationSK, AreaSK, and the ProjectSK fields in the Analytics View.
ODATA
Here is a link to resources to get started with using ODATA queries to return the workitems for the report. Follow the steps in this blog to get started writing and testing the ODATA queries. It is not hard once you get started in VS Code.
Rename the table to Workitems. This is the fact table in the data model. The ODATA queries will connect to this table through the surrogate keys. Power BI will detect and create these relationships automatically.
Other ODATA Queries
The following instructions show how to add the ODATA queries for team projects, iterations, area paths, and users and establish a star schema data model in Power BI desktop.
The best way to ensure the ODATA query works in Power BI desktop is to test the query using Visual Code. Check out this blog post on setting up the Visual Code editor to run ODATA queries.
Investigating the ODATA Entities and Fields
The online documentation doesn’t include all available ODATA entities and fields. Execute the following ODATA query to see the entities, or tables, in your ADO organization. This resource is your main reference for finding entities and fields in the ODATA query for Power BI reports. This help file gives detailed instructions on constructing the ODATA query.
NOTE: Replace <ADO Organization> with the name of your ADO organization. Replace <Team Project> with the name of the ADO Team Project in the following queries.
https://analytics.dev.azure.com/<ADO Organization>/_odata/v4.0-preview/$metadataADO Team Projects
The ADO Team Project list is only needed in the reporting if you are creating an enterprise level report with work items from multiple team projects. You can certainly add this to the report even if the report contains only one team project.
// TEAM PROJECTS
https://analytics.dev.azure.com/<Your ADO Organization>/_odata/v4.0-preview/Projects?
$select=ProjectName,ProjectID
&$orderby=ProjectName
Area Path and Iterations
Areas and iterations in Azure DevOps show the project’s structure. You can use OData to get data that matches the project’s layout, such as a tree of areas and work items. This helps you analyze work items by area or find problems in some parts.
OData lets you compare metrics (like cycle time, lead time, or defects) for different areas. This helps in improving resource use and finding areas to improve. By using iteration data, you can predict future work. This helps in planning capacity, making sure teams use resources well for next iterations.
Run these queries at the Team Project level.
// # AREA PATHS #
https://analytics.dev.azure.com/<Your ADO Organization/<Team Project>/_odata/v4.0-preview/Areas?
$select=AreaSK, AreaName, AreaPath, Number

// # ITERATIONS #
https://analytics.dev.azure.com/disp/<Your ADO Organization>/<Team Project>/_odata/v4.0-preview/Iterations?
$select=IterationName,Number,StartDate,EndDate,IterationLevel1,IterationLevel2,IterationLevel3, IterationLevel4,Depth,IsEnded
Users
OData queries allow you to get work items that belong to specific users. This information is important for balancing workload, finding obstacles, and ensuring fair distribution of tasks.
By querying data related to users (such as work item counts, completed tasks, or lead time), you can measure individual productivity. This helps in performance reviews, resource assignment, and identifying high-performing team members.
Analyzing historical data for individual users enables you to discover patterns. For example, you can monitor how a developer’s bug-fixing effectiveness changes over time or how their work matches sprint goals.
https://analytics.dev.azure.com/<Your ADO Organization>/<Team Project>/_odata/v4.0-preview/Users?
$select=UserID,UserSK,UserName,UserEmail,AnalyticsUpdatedDate
Adding the ODATA Queries to the Power BI Report
Power BI Desktop has an ODATA connector called the ODATA Feed. The default option is to paste a single line into the feed and establish the connection. The recommended approach is to select the Advanced option to allow for the multi-line ODATA query. This makes it easier to change the ODATA query in Power BI through the Power Query editor. If the ODATA query is condensed to a single line, the changes to the ODATA query become almost impossible to make.
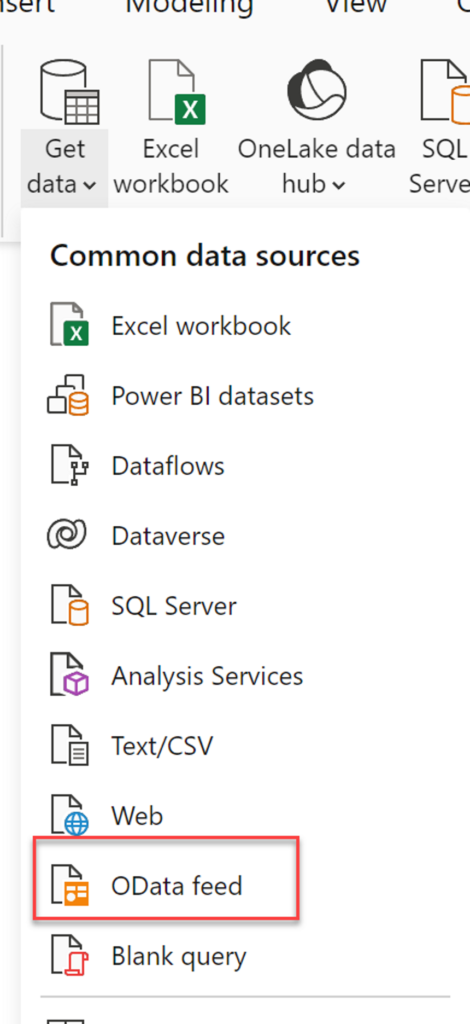
In Power BI Desktop, select Get Data -> ODATA Feed -> Advanced
For example, adding the ODATA query to retrieve the Team Projects for the ADO organization.
https://analytics.dev.azure.com/Your ADO Organization/_odata/v4.0-preview/Projects?
$select=ProjectName,ProjectID
Each clause, which is a line starting with $ or &, of the ODATA query goes on a separate line in the connector.
Select the Add part button to add a new line for additional lines in the ODATA query
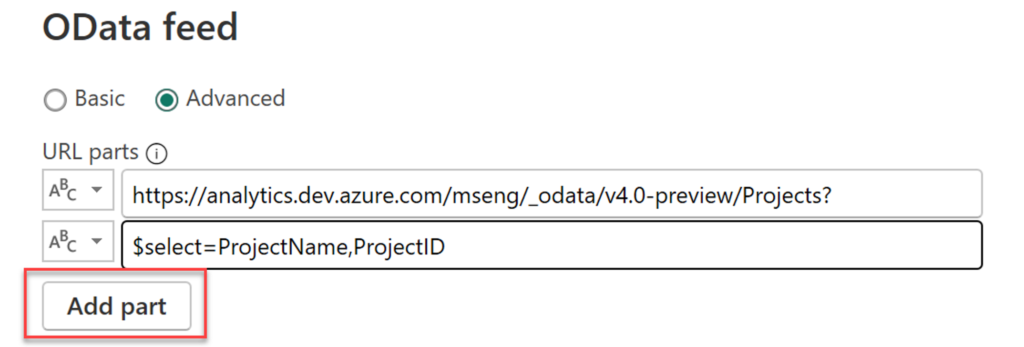
Select OK
Enter credentials to authenticate if prompted. Use the Organizational Account option and Sign in
Establishing the Relationships between Tables in Power BI
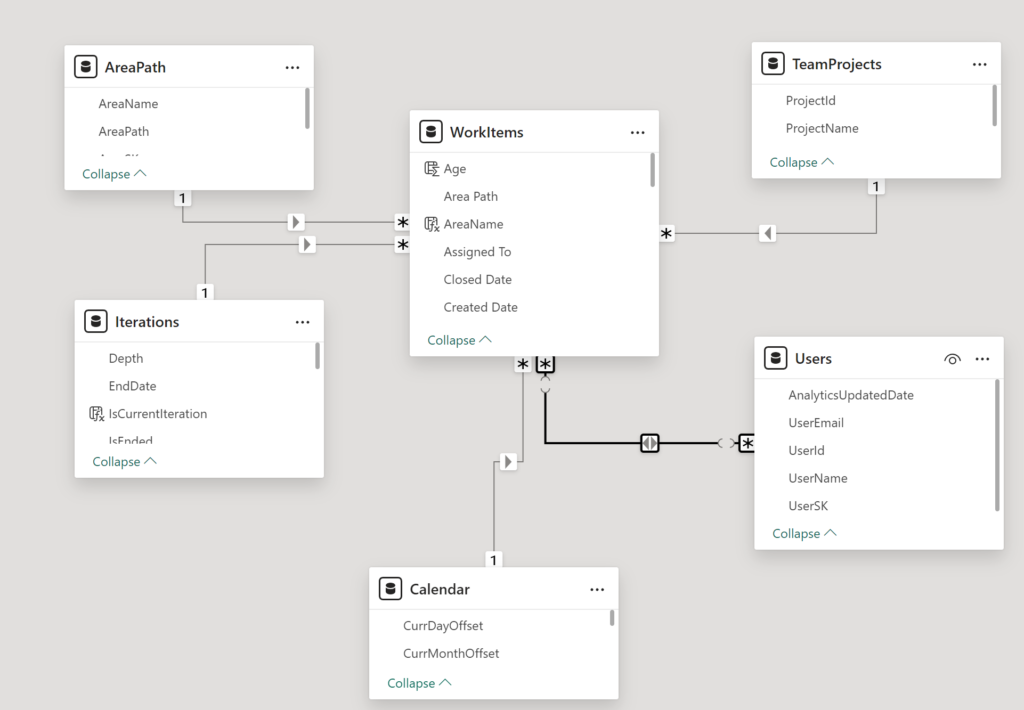
The following steps will show how to structure the relationships to use the Work Items as the fact table and the others as dimension tables.
On the initial load of the dataflow, PBI desktop will attempt to establish relationships between the tables. It may get some of the relationship correct, like the Area Paths and Team Projects tables.
Open the model view in Power BI Desktop.
Center the WorkItems table as the Fact table. This is what your data model will look like after the relationships are created.
ADO Team Projects
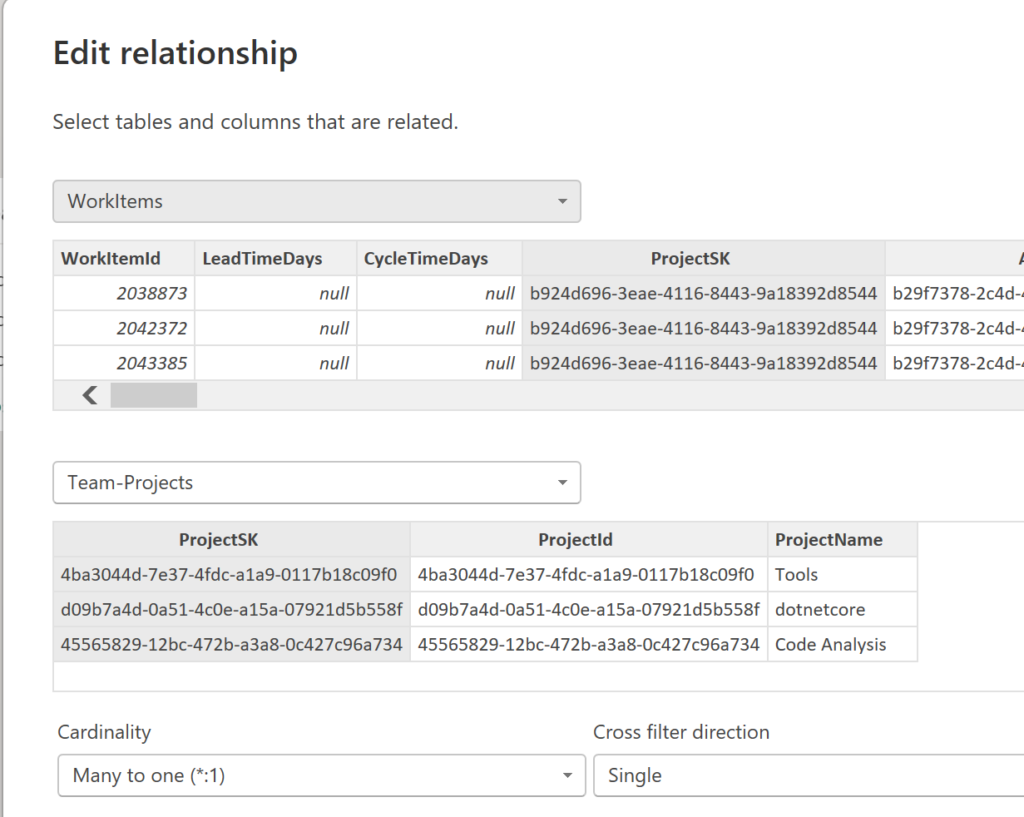
The analytics view contains the Project Name and ProjectSK fields. Use either field to create the relationship between the Workitems and the Team Projects tables.
This example uses the ProjectSK field to create a one to many relationship between the Team-Projects table and the Workitems table.
Add the ProjectSK field to the analytics view and refresh the data if it is not present. This blog post explains the process of updating the analytics view in ADO and refreshing the data model in Power BI.
Area Paths
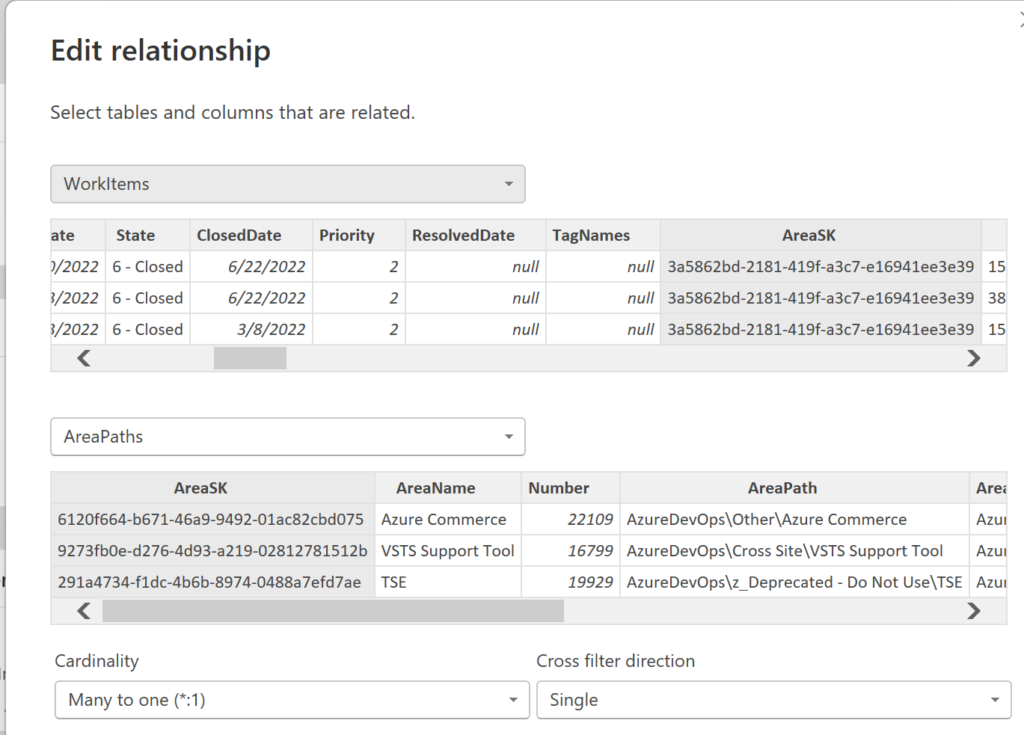
Establish the relationship between Area table on the AreaSK field with the WorkItems table
The Area Path table should have a one to many relationship with the WorkItems table.
Iterations
Creating the relationship between the workitems table based on an analytic view with the ODATA list of iterations is not as easy as the Area Path table. The analytics view in ADO does not have an AreaSK field, like there is in the ODATA query. The connection between the ODATA Area Path table and the Workitems table uses the Area Path field.
There are additional steps required in the analytics view to create the Iterations field from the existing field. The analytics view field contains each level, or node, of the iterations. The ODATA query’s iterations field contains the last node in the iteration Path.
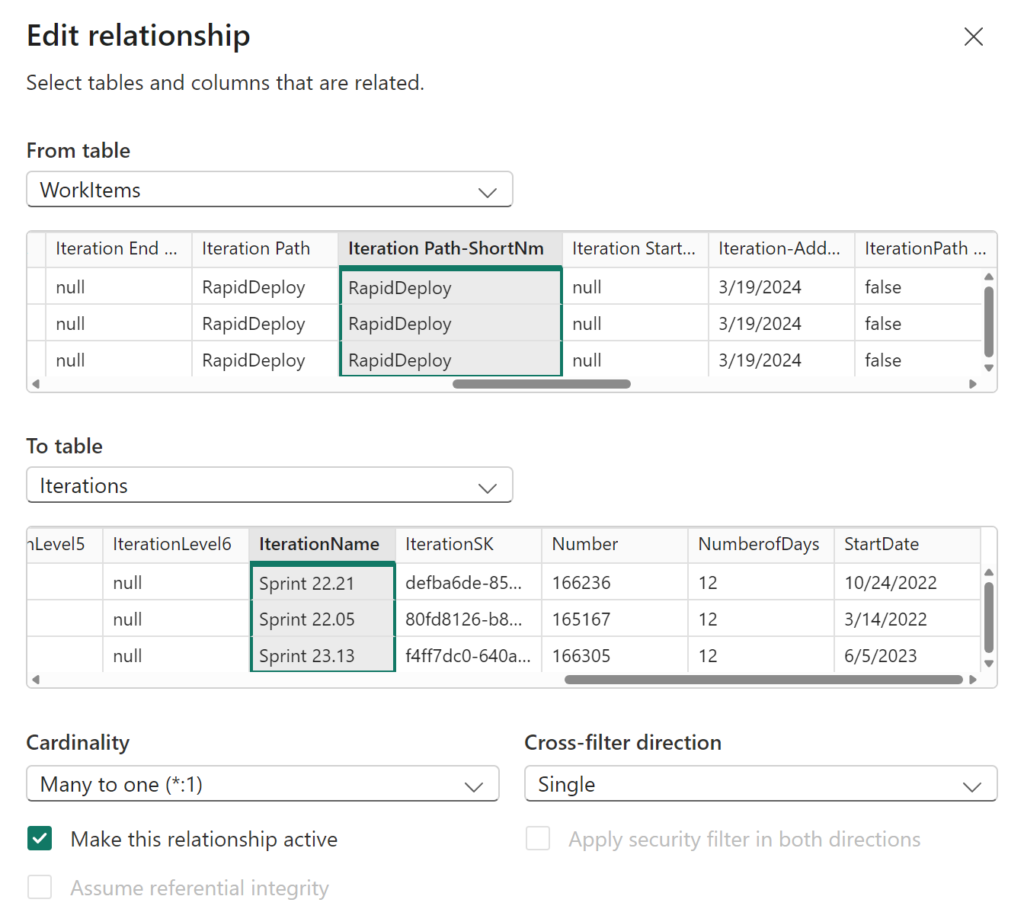
This is the output of the ODATA query on the iterations. The Iteration Name field contains the last node in the iteration path. The other nodes are contained in the Iteration Level 1, Level 2, and so forth.

The analytic view’s Iteration path field contains all the nodes in the iteration path. This prevents an easy connection for the relationship.
This blog post shows you how to shorten the iteration path field in the analytics view to the last node. You want the Iteration name field to contain the actual number of the iteration. This will match the ODATA IterationName field.
This is the view of the relationship between the Workitems table and the Iterations table using the new Iteration Path-ShortNm field in the analytics view.
Users
The analytics view contains the Assigned To, Created By, Closed By, etc. user fields with the user’s full name. Adding the Users ODATA table is not always needed for basic reporting. Add the Users ODATA table if you need to report on users in ADO and their interaction with ADO outside of workitems. If you need to report on pipelines, testing, repos, etc. then the Users ODATA table is helpful since the ODATA entities only contain the UserSK field. This allows you to link the UserSK field in the ODATA entities to the UserSK field in the Users ODATA table.
Your data model is now complete!