Options to Select the Data Model for Azure DevOps Reporting
When it comes to data reporting, particularly with Power BI for visualizing Azure DevOps data, selecting the right Power BI data model for Azure DevOps reporting is crucial. A well-chosen data model simplifies the management of visualizations and enhances the efficiency and comprehensibility of measures. There are various options available for working with Azure DevOps data, and this blog highlights the models I have successfully used in customer reports. While not exhaustive, these models have proven to be highly effective for reporting purposes. This blog post will help you select the data model for Azure DevOps reporting in Power BI.
Single Fact Table Data Model:
At the most basic level in reporting is having a single table of workitems. This table is constructed using either an Analytics View (AV) or ODATA and considered a flat file format. Meaning, it contains the iterations, area paths, team project, and user information within the table. AVs are inherently single-dimensional and return all related data in each row, eliminating the need for dimension tables, except for a calendar table or a separate table for tags. This approach is the simplest way to start reporting with ADO data and is amazingly easy to maintain. This data model is designed for smaller reports, focusing on team or department-level reporting.
Here is the blog post to implement this data model.
Star Schema Data Model:
One of the most efficient and widely recommended models is the star schema. This schema is characterized by a central fact table connected to multiple dimension tables, resembling a star shape. It allows for simplified queries and improved performance, making it ideal for handling large datasets and complex reporting needs.
When reporting with Azure DevOps data, the star schema features a central table of work items, known as a fact table, surrounded by additional tables like iterations, area paths, team projects, users, and tags, which are referred to as dimension tables. Utilizing ODATA to retrieve this data is both intuitive and straightforward to implement. An AV can serve as the fact table for work items, and it can be integrated with ODATA queries to access the dimension tables.
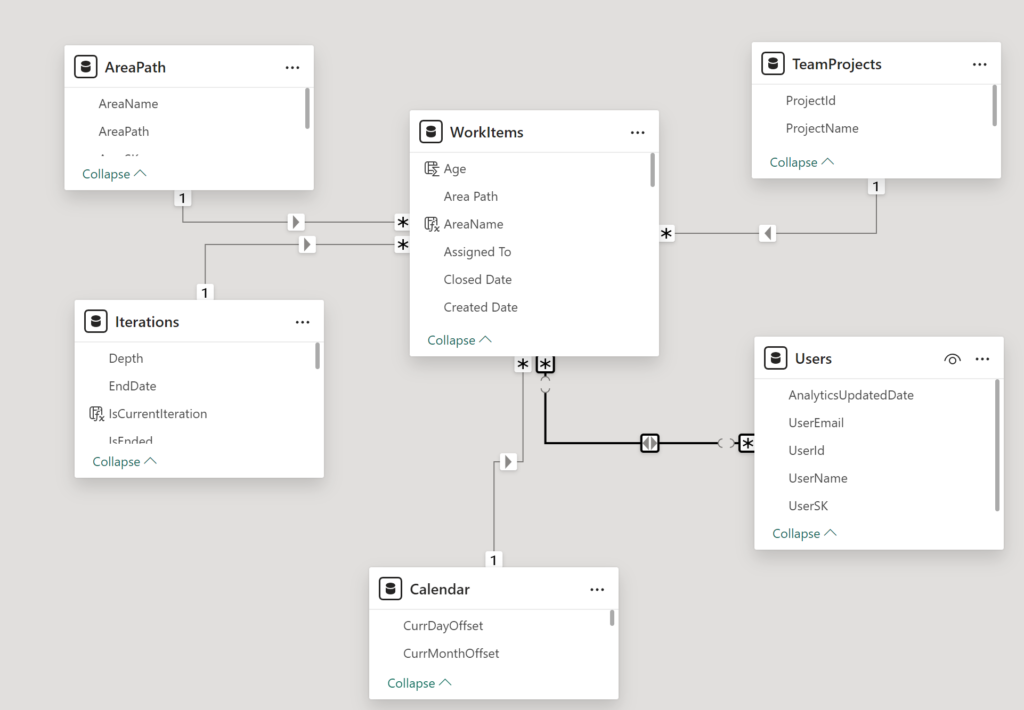
This data model is effective for enterprise reporting of ADO data, as it consolidates work items from multiple teams or projects into a single table, categorized by team project names. However, it has a limitation: it only supports interaction between parent and child work items at one level within the fact table. This means that a parent work item can only recognize one level below it. Consequently, if a report includes Epics, Features, User Stories, and Task work item types in a single table, there is no natural hierarchy among the work items, making roll-up calculations challenging.
This blog post shows you how to get started with the star schema data model using Analytics Views or ODATA. This is a great way to get started with your Azure DevOps reporting!
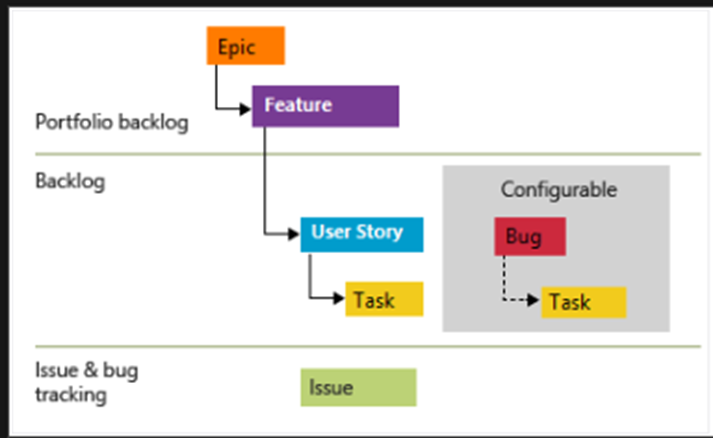
Hierachy of Workitems with Relations – Parent/Child Data Model:
Another significant model is the hierarchy schema, which organizes different work item types in separate tables and links them together. This schema is particularly effective for maintaining the relationships and hierarchies within the data, ensuring that complex dependencies are accurately represented. As illustrated below, Azure DevOps data is hierarchical within the product, allowing for parent/child relationships between work item types. By implementing a hierarchical data model, the report preserves the connections between work item types, making it possible to display parent/child relationships in the reports, such as showing all the child features related to a selected epic.
There are limitations to this data model such as dealing with unparented workitems and workitems associated with multiple parents. The measures in the reports will need to handle these situations and adjust as needed.
This data model allows the report to show the parent/child work items on the same report in the visuals. It also allows for easy rollup metrics from the parent the grandchildren work items. Meaning, from the Epic to the task level. Here is the blog post on how to implement this data model and the measures to create the rollup metrics.
Star Schema with Parent/Child Relations Data Model:
The star schema in Azure DevOps data has a limitation where it only supports interactions between parent and child work items at a single level within the fact table. This means a parent work item can only recognize one level below it. To address this issue, a new data model introduces a table that captures all parent/child relationships between work items and includes fields for rollup calculations. This enhancement allows reports to calculate the total story points in User Stories for an Epic, count the number of bugs attached to tasks, and roll these up to the Theme level or other Portfolio Backlog level work item types.
Implementing this data model is straightforward, though it necessitates the use of ODATA for the relations table. The ODATA relations table can be paired with another ODATA fact table or the Analytics View table as the fact table. This approach provides an exceptionally simple method for creating rollup calculations across enterprise data. Here is the blog post to show you how to implement this data model in the Power BI report.
Star Schema with Parent/Child Relations and Hierarchy Data Model – The Everything Data Model:
This comprehensive data model integrates the star schema, parent/child relations table, and hierarchy data models, creating a cohesive and advanced structure. It is particularly beneficial for managing multiple levels of work item types, such as Themes, Epics, and Features, which need to interact seamlessly. The model facilitates displaying parent work items alongside their child work items in a table, and supports rollup calculations from lower-level work items to portfolio-level ones. While this integration can be complex and requires careful planning, the result is a robust data model capable of handling enterprise-level reporting.
Summary:
It is crucial to carefully select the data model for Azure DevOps reporting for efficient data reporting with Power BI, especially when visualizing Azure DevOps data. Various models can be used, each with its own advantages. A single fact table, constructed using an Analytics View (AV) or ODATA, is the simplest model, ideal for smaller reports. The star schema, with a central fact table connected to multiple dimension tables, is recommended for handling large datasets and complex reporting needs. It consolidates work items from multiple teams or projects but has limitations in recognizing hierarchical relationships. The hierarchy schema organizes different work item types in separate tables, maintaining relationships and hierarchies within the data. A more advanced model integrates the star schema, parent/child relations table, and hierarchy tables, supporting rollup calculations and managing multiple levels of work item types. This comprehensive model is beneficial for enterprise-level reporting, despite its complexity.