Quickly Query ADO Workitems with Tags using a ODATA
When using Azure DevOps (ADO), you may observe that tags associated with work items are returned differently depending on whether you employ Analytics Views (AVs) or an OData query. AVs return a delimited list of tags within a single column, whereas OData returns the tags as a separate table, which must be considered in the data model. This inconsistency can result in confusion and challenges when attempting to generate consistent reports. This blog post provides a detailed walkthrough for query ADO workitems with tags in an OData query and establishing the relationship between the tags table and work items.
ODATA QUERY:
The advantage of the AV method to delivering tags is that it is in a single column. However, to really use the list of tags, you need to break out this list into its own table to allow and add to the data model. The ODATA query returns this list of you in its own ODATA query!
To associate the workitems to the tags, use the following ODATA query. It returns the list of workitems and the associated tags. The &$expand function returns the associated tags to the workitem from based on the TagsSK field from the Tags table. It acts like a join statement between the workitems entity and the tags entity. Adjust the $filter clause to meet your reporting needs.
https://analytics.dev.azure.com/<Your-ADO-Org>/<Your-Team-Project>/_odata/v4.0-preview/workitems?
$select=WorkItemId,WorkItemType
&$expand=Tags($select=TagName,TagID;$filter=TagName ne null)
&$filter=(CreatedDate ge 2023-01-01Z) and (State ne 'Removed') and (WorkItemType eq 'Epic' or WorkItemType eq 'Feature' or WorkItemType eq 'User Story' or WorkItemType eq 'Issue')
This blog post shows you how to test the ODATA query in VS Code and move it to the Power BI report to retrieve the data.
FORMATTING the DATA in POWER QUERY EDITOR:
When the data loads, it will return as a table. Expand the table of tags.
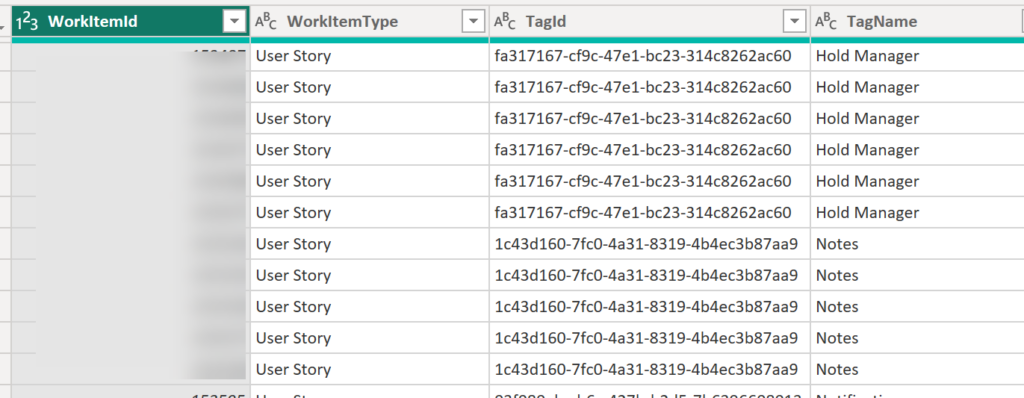
With the data now expanded, the tag names, ID, and associated workitem ID are in the table.
Select Close and Apply to load the data.
DATA MODEL:
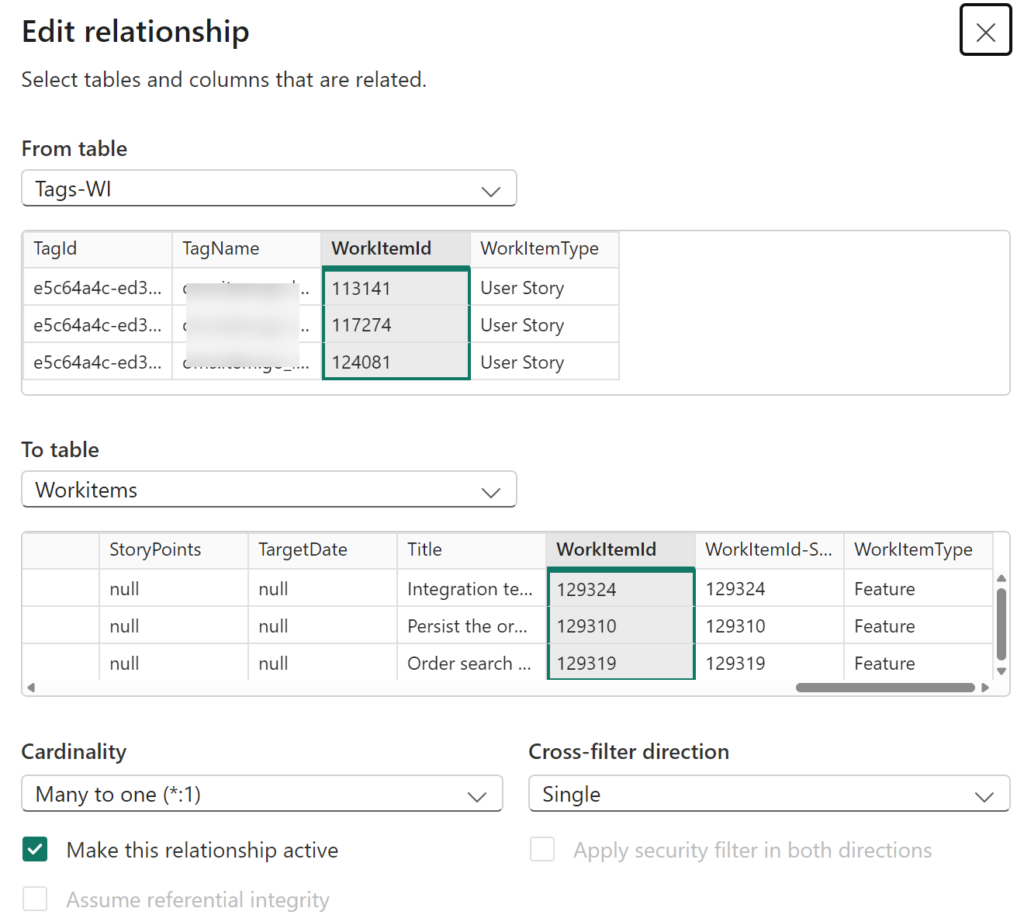
Navigate to the data relationship view in Power BI.
Drag the Workitem ID from the Workitems table to the Tags-WI table. This creates a one-to-many relationship between the tables and allows for filtering on the visuals.
Check out this blog on creating a method to use Power BI slicers and tags. It is easy to implement now that you have the hard part done!
Potential Error:
Ran into this error code when designing a report:
(VS403483: The query specified in the URI is not valid: VS403489: The Analytics Service doesn’t support key or property navigation like WorkItems(Id) or WorkItem(Id)/AssignedTo. If you getting that error in PowerBI, please, rewrite your query to avoid incorrect folding that causes N+1 problem..)
The tags were returned as a table within the ODATA query and I tried to expand the column and received the error. The problem is that I did not use the $Expand function to return the values as a separate table. In my situation, Power BI was trying to return to the ADO analytics service for each row in the table and this is a no-no.
The resolution is outlined in this blog post. Return the tags as a separate ODATA entity and link to the workitems table.